We recently completed another round of workshops with Grade 10 learners, following the first round in March, in partnership with Umkhumbane Schools Project in Cato Manor, Durban. Two WESSA youth educators joined us this time, hopefully we’ll work together in future.
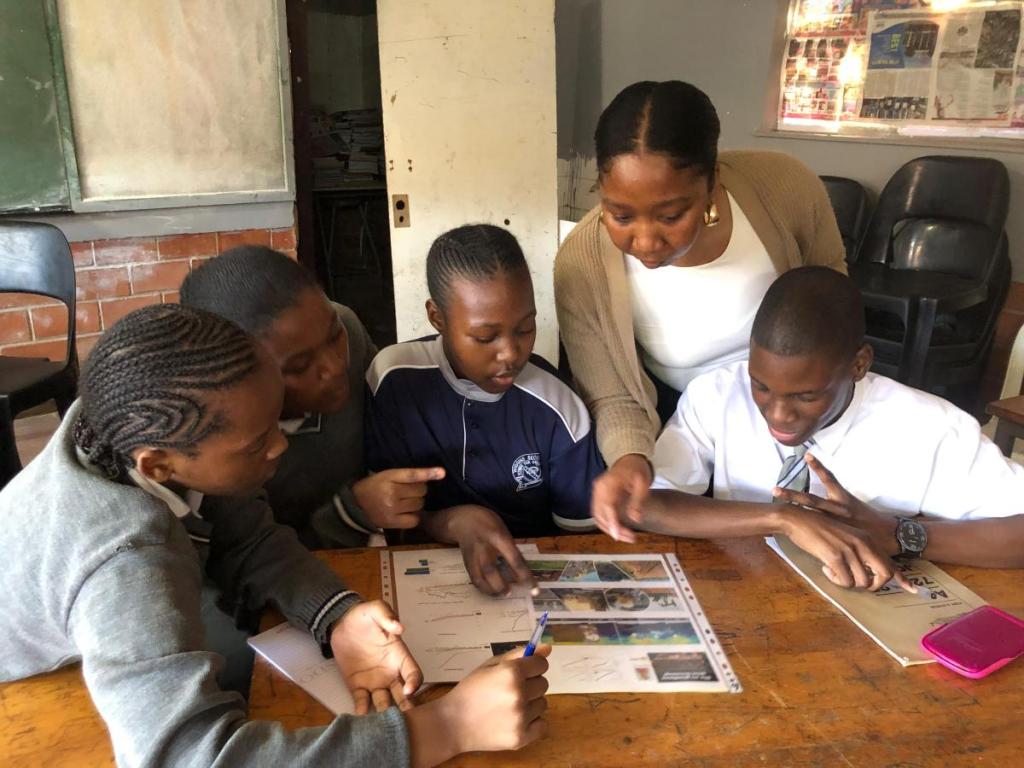
Since the last workshop series in March was a while ago, we started with a refresher exercise. Instead of me (the facilitator) doing the talking, we split up the learners into small groups, and gave each group a print-out of one of the videos we watched previously, to refresh their memories.
The learners then presented the slides to the larger group and gave brief summaries of anything they had remembered. I reminded them that this was not school and that there was no evaluation, that they should not feel pressured or stressed, but just quickly walk us all through some of the highlights. This was a fun and highly entertaining, the learners were very enthusiastic.
Learners refreshing their memories
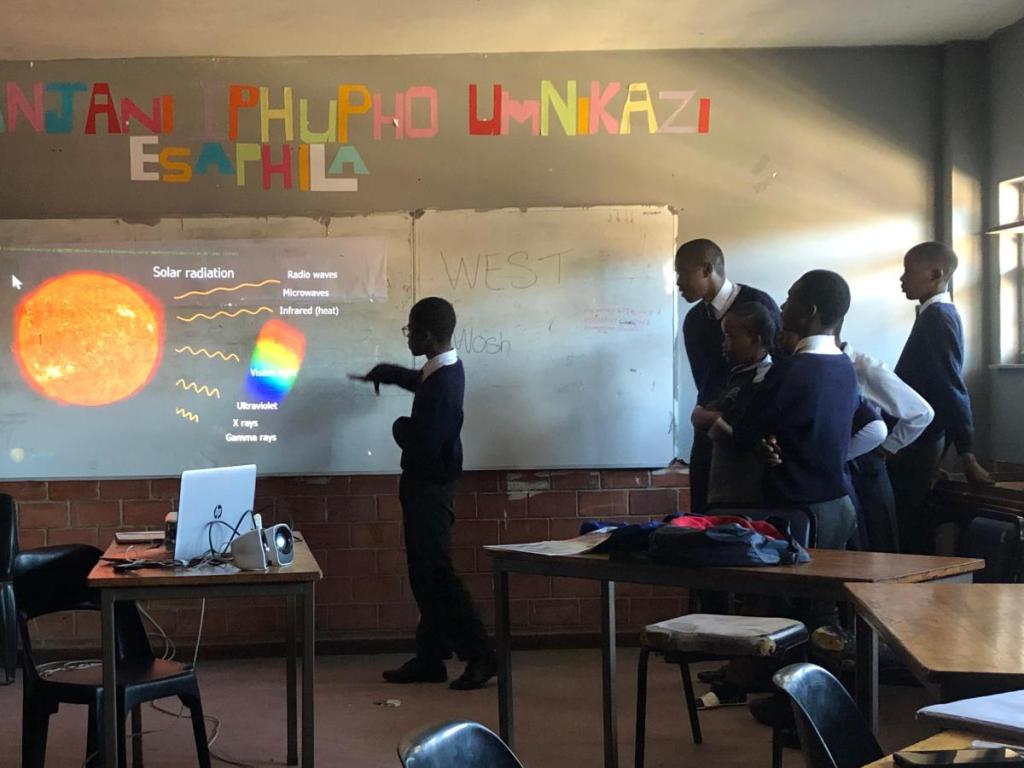
Learners presenting a summary from the last workshop
Unit 7 “What does climate change look like”?
The video for this unit shows the many faces of climate change – changes in the weather, changes on land and in the oceans, changes in the frozen parts of the world, sea level rise. We all felt a bit depressed at the end. But everyone agreed when I said, “These things are happening anyway, whether we are aware of it or not. Myself, I prefer not to be ignorant of what is going on. I would rather know, because then I maybe do something about it, and also then I can adapt my life and not get caught by surprise.”
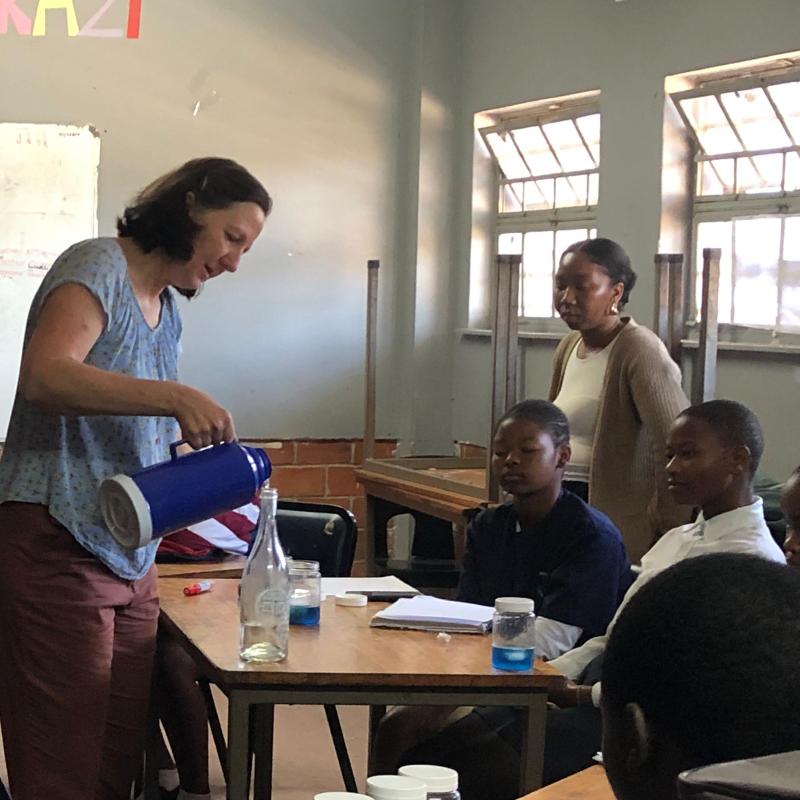
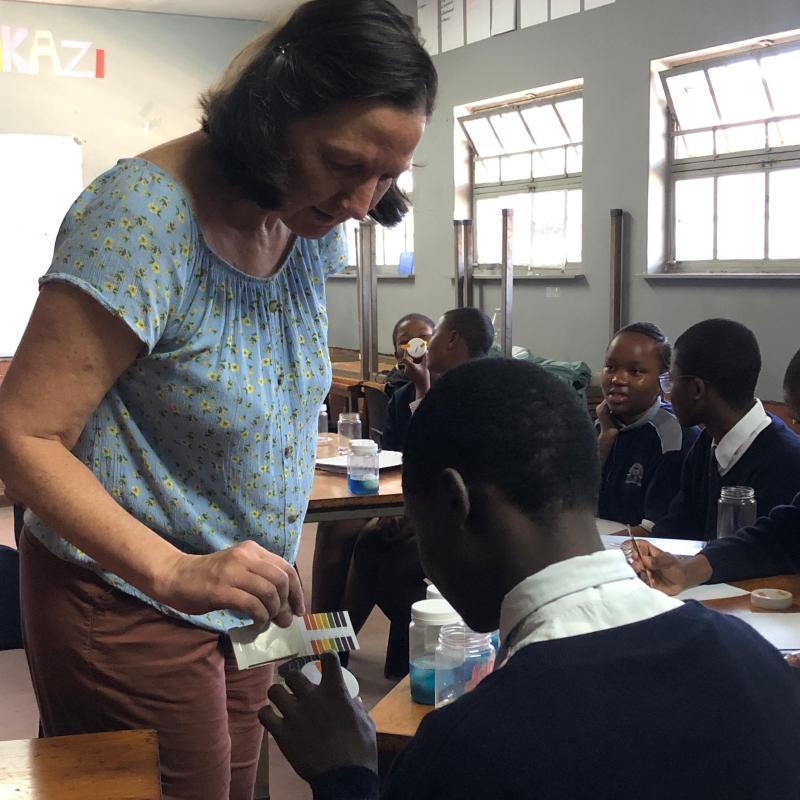
We then carried out two simple experiments about sea level rise caused by melting glaciers and warming oceans, and one about ocean acidification and the effect on calcium carbonate solubility.
Do melting sea ice and land ice both cause a rise in sea level? Marking the ‘sea level’.
Demonstrating that hot water takes up more space than cold water.
Do sea shells dissolve in acidic water? Checking the pH.
Unit 8 “Why should I care? How does climate change affect me?”
On the first day the learners went home with a questionnaire, to interview an older person in their household. They asked about any changes or disasters they had experienced during their lifetime.
On the second day, learners interviewed each other, in a mock TV show, talking about their family’s – or their own – experiences and opinions. “Who has family or friends who may not have heard about climate change? What could you say to them? How would you explain climate change to your granny?” I was blown away with the confidence and enthusiasm with which the learners threw themselves into this activity.
The results speak for themselves. Enjoy!
The Unit 8 video covers the many ways that climate change affects us as humans – our food systems, health and wellbeing, the economy – and how it can cause poverty, displacement and conflict. It explains how we depend on nature and how climate change threatens our entire society, often in complex ways.
While watching the video, learners listened out for facts that might answer the question: “Why did the Nobel Prize for Peace get awarded to people who spread knowledge about climate change? How could climate change disturb the peace, between individuals, communities or countries?”
Learners paired up to discuss this question, we collected ideas from the floor and discussed them in the big group. Responses included: communities or countries fight over scarce resources, such as food, wood or water; people fight with their governments over policies or unfair food allocations; activists fight with law enforcement; ‘false activists’ turn environmental causes into terrorism. Another two short videos, by international peace organizations, rounded off this section.
The learners’ responses were very insightful and thought-provoking.
Unit 11 “What can I do about climate change?”
Finally we get to the most important part: action. The interactive video highlights the top priorities, based on where the most greenhouse gases come from, and where action would therefore have the greatest ‘bang for buck’. It also talks about climate justice, an important topic for young people living in underprivileged conditions.
Unit 13 “Electricity”
The third day was devoted to the top action area: energy – more specifically, electricity. We started with a game called ‘Circuit Breaker’, where we passed ‘electrons’ from a ‘battery’ around a ‘circuit’. One person was the ‘switch’, another the ‘radio’, another a ‘resistor’. When things got out of hand, and ‘sparks’ started to fly, the ‘circuit breaker’ tripped, and the game had to be ‘reset’.
How fast can you make the ‘current’ flow?
Then we talked about electricity in the home: the distribution board, the electricity meter, different ways of purchasing electricity.
It’s easy to save electricity in the home, just by doing things slightly differently. Thereby we can reduce our energy carbon footprint as well as our monthly electricity bill. So how much power does it take to boil a cup of water – in a kettle? On a stove? In a microwave? We timed boiling water with different appliances, and converted the answers to kWh, grams of greenhouse gas emissions, and into Rands and cents. Then we cooked a pot of rice by wrapping it in a blanket.
Boiling water in a kettle used the least power.
A pot of rice, once boiled, can cook in a hotbox without further power.
On a personal note: I (Marlies) would like to thank Martha Bishai and her team at the Umkhumbane Schools Project – especially Precious, Nokwanda – from the bottom of my heart for their support and partnership. Years ago Martha invited me to engage their biodiversity group. Since then Martha’s encouragement and participation inspired me to keep going forward, and to dare think bigger and aim higher. I am deeply grateful for believing in this work and investing in EASTER Action!
With this blog I’m happy to share the experience from the first three sessions in a series of climate change workshops with Grade 10 learners, in partnership with Umkhumbane Schools Project in Cato Manor, Durban.
The plan is to work all the way through the What I Can Do About Climate Change edu-action programme, with the same group of learners, firming up the contents, seeing how it is received, and refining the program so it can be implemented by other facilitators in the future, making it more accessible and impactful.
Over three days in March 2025, we completed six units with the same group of students, allowing us to gauge their feedback and see how the material was received. We ran three 2-3 hour sessions over consecutive days, with a mix of short video presentations and interactive, hands-on activities. We covered 6 units, and plan to carry on later in the year.
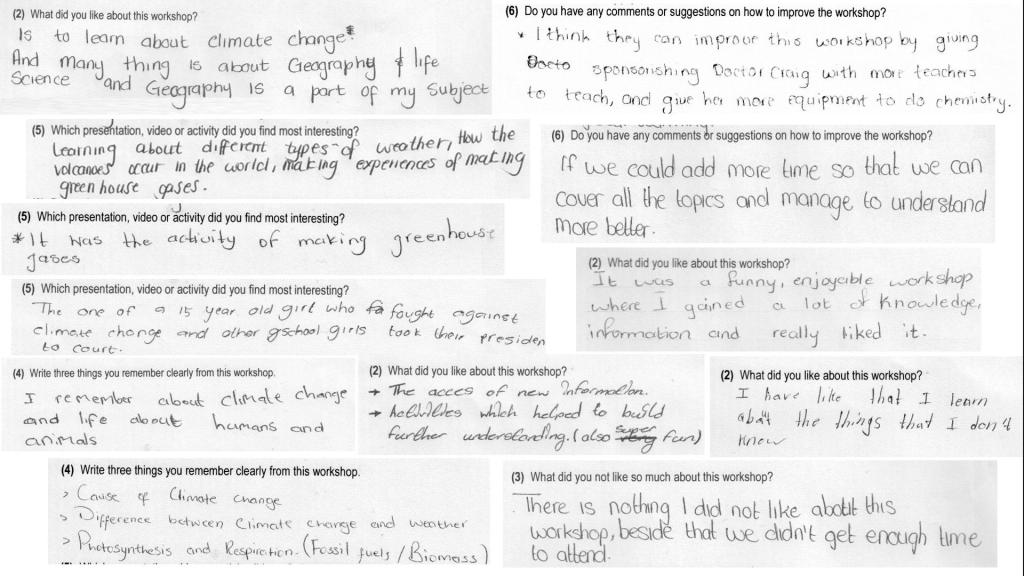
Based on the heart-warming and enthusiastic feedback from the learners, it is clear they found the sessions enjoyable and valuable. As the facilitator, I also had much fun, and learned things that will help me update the activities, and add some more teaching material.
Here are a few samples from learner feedback. My favourite: “It was a funny, enjoyable workshop where I gained a lot of knowledge, information and really liked it.” – If even one learner felt like that then mission accomplished!
Keep on reading for a more detailed account.
Unit 1 “What on earth is going on?” – about youth activism
The programme kicks off by empowering learners, showing them that before we are individuals, we are citizens of the world. Before even mentioning climate change, this introductory session places the youth at the forefront and shows the role they play in world affairs. It encourages young people to think at the global scale, rather than taking the small-scale view of ‘me, here, now’. Hopefully this arouses an inner sense of importance, relevance, empowerment and capacity.
The interactive video followed by two activities always work well. I have done this many times so there were no surprises. The fun quiz, using Plickers, is always a favourite.
Unit 2 “What is climate change?” – a brief overview
The video gives a very brief overview of climate change. It explains how the world is getting warmer, how this is causing record-breaking global warming and devastating world-wide impacts. Climate change is caused by a sudden recent rise in greenhouse gases to levels which humanity has not seen before. It is a human-made crisis, and it will get a lot worse unless we urgently do something about it.
The activity involves a community survey. The survey is not about gathering information or finding out what people know, its purpose is to give learners a way to ‘interview’ friends or family and so introduce the topic of climate change respectfully and in a neutral and engaging way. At the workshop, learners filled in the survey themselves. They said it was ‘easy’ and were confident and keen to take a second form home.
Two days later, their feedback was very positive. They enjoyed doing it. Some learners had interviewed school mates, or the whole family, or a brother. One learner who had interviewed a cousin at university, felt pleased that she knew more about the subject than the university student.
The feedback they got in turn, was also encouraging: they encountered positive interest rather than any negative responses, and it helped them to talk about the information that they had learned in the workshop.
Unit 3 “Weather or climate?” – the water cycle
The video explains the difference between weather, climate and paleoclimate, and the science of the water cycle. While we couldn’t get the students’ tablets online, we managed to do a live demonstration using Windy.com to show real-time global weather patterns. The learners were fascinated, especially when we located a cyclone over the Indian Ocean.
Unit 4 “Why is the world getting warmer?” – the greenhouse effect
The video starts relatively simple, but then gets increasingly technical. The learners were surprisingly interested in the science. I had planning to stop the video before it got to some really advanced topics (such as the radiation absorption patterns of different atmospheric gases), but they were all keen to carry on.
The learners all take science as a subject, so they had a reference point, and this lesson must have connected with things they already knew, they were just hungry for more! It was delightful seeing in them this appetite for scientific knowledge that also drives me to dig deeper into a topic until I am satisfied and my questions have been answered.
One activity explains global warming in terms of body temperature, to illustrate the importance of one degree of warming. Except for two willing volunteers, most felt too old for the ‘running around’ part, but they were deeply interested in all the information about ambient and body temperature.
It was really sweet: when I gave some learners a lift back to their school at the end of the workshop, they started rehearsing in the car the different temperatures: healthy body temperature, what is a fever, when you should go to hospital, what temperature is deadly. They found it fascinating that feeling hot is not the same as being sick. Well, it IS fascinating, isn’t it?
I had also pointed out how important this knowledge is for when they are adults and have their own children. It had little to do with climate change, but I love bringing real-life knowledge into these lessons, to show how science is not just something you learn at school, but something that is important in life – quite literally!
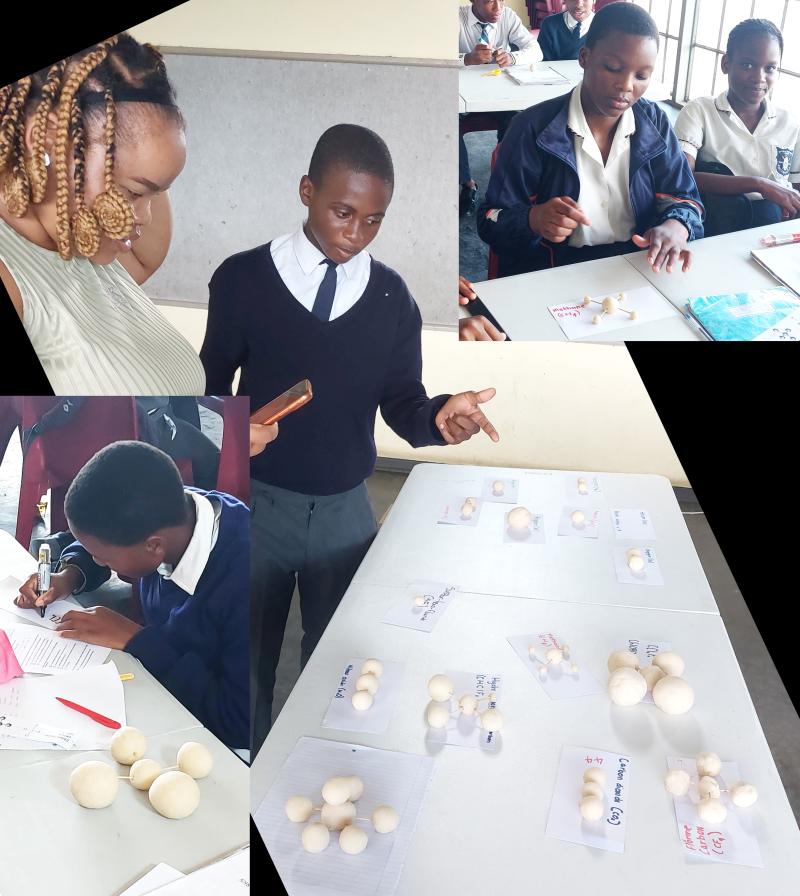
In another activity, learners created molecular models of atmospheric gases with playdough and match sticks, and we discussed which are greenhouse gases – or not, and why.
Unit 5 “Where do greenhouse gases come from?” – the carbon cycle
The next video shows how the main three greenhouse gases are deeply connected with life and living things. It turned into an impromptu science lesson, as I realized that some of the information in the video assumed prior knowledge they did not have.
We burned biomass (a dry twig) and watched the wood turn to black coal, we demonstrated how white wax and clear paraffin are indeed carbon-based fuels (by catching soot from the flame on a white saucer), and how burning a candle under a jar does indeed use up the oxygen in the air (the flame dies), producing energy (the flame) and water (steamed-up jar) – we could have tested for CO2.
The biggest thrill was a methane experiment. I had brought a bottle of gas, and showed them pictures of how I had produced this from kitchen waste and pond water. (Ideally they should do the experiment themselves.) We bubbled the gas through soapy water and ignited the foam, creating a little fireball. We all got terribly excited! What a memorable moment!
Unit 6 “Why are greenhouse gases increasing?” – the root causes of climate change
This unit explored the root causes of climate change, specifically fossil fuels. This led to an important side lesson, and I realized we need another video on what fossil fuels are and how they are formed.
The session wrapped up with a highly interactive game, ‘Fossil Fuel Bingo,’ about which everyday fuels are fossil fuels and which are biomass fuels. It was so much fun they asked to play it a second time.
This workshop was a powerful reminder of how eager young people are to learn and get involved. We’re looking forward to continuing our journey with them later this year. Stay tuned for our next workshop as we continue to build a generation of climate-doers.
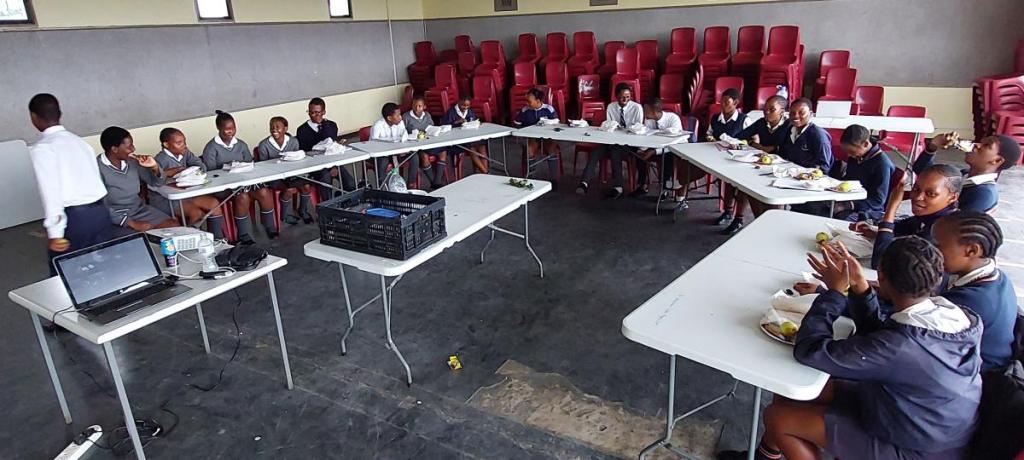
On the best-attended day we had 35 learners, the very limit of how many one facilitator can interact with effectively. With fewer learners one can sit in a circle which is more intimate and feels less like school.
Let me report back briefly on three recent events with Kloof High School, which have been extremely rewarding and motivating.
After attending the recent WESSA KZN EcoSchools Prizegiving, where Kloof High got their first Green Flag for environmental activities, Corné van Vollenstee (Life Science subject head, who also heads up the environmental club) reached out to me with a request to help the school introduce environmental education across all subjects.
Wow! This was so proactive of Kloof High, and such perfect timing for EASTER Action!
Having finalized the first four units of the What I Can Do About Climate Change programme, and piloted them from my side, it was time to test the hand-over process. One-by-one we will never reach enough people to make a measurable difference. Knowledge, know-how and determination to act – these have to spread throughout society, and urgently!
Introductory session
To begin with, Corné wanted to engage her fellow teachers, to try and get everyone interested and on board. So, end of May, we had an interactive session on climate change with the entire staff of 65, to raise this critical global issue.
The teachers were very interested and responsive, which was encouraging. Positive feedback included: “Very interesting and informative… interactive and engaging… Activities were an eye opener… A real wake up for me!… The practically and relevance of the topic and how it relates to the educational space… Very user friendly advice… Thank you we enjoyed. Please come again. It was so educational.”
Some asked for “more activities that we can do at home to help with eco systems… a digestible version of the presentation to direct towards learners/youth… should be an ongoing initiative.”
Getting ready for the ‘WOW’ moment that never fails to leave a lasting impression: which sector produces the most greenhouse gases – and by how much…
Co-production workshop
Being very supportive of this new initiative, the headmaster agreed that we should pursue a partnership to take this work forward. The plan is to run drafts of the 80-or-so activities that form part of the WICD programme through a process of co-production and review, and for the teachers to try out some activities with their learners.
End of July, the 16 subject heads participated in a 1 1/2 hour workshop, where they received a more detailed introduction to the WICD programme. Then we spent an hour watching the first four little videos, and going over the first batch of activities. There was something for almost every subject.
The teachers each picked an activity that might be relevant for their subject, reviewed it and filled in a detailed feedback form. They responded to questions such as: What do you like about this activity? Pros? – What do you not like? Cons. – What practical or other challenges do you foresee? – Does the Aim make sense as stated? If not please suggest alternative. – Can it double up as a school project or practical? – If it allows assessment, how would you assess it? Draft a rubric. They rated, if applicable, the suitable age or grade level for the activity, and in some cases indicated a particular part of the curriculum the activity speaks to.
The very helpful comments and suggestions are being incorporated into the programme currently.
Even though it was just a short session, and only a limited number of activities could be processed this time round, it proved that such a co-production workshop can generate much valuable feedback that draws on the practical expertise of in-service educators.
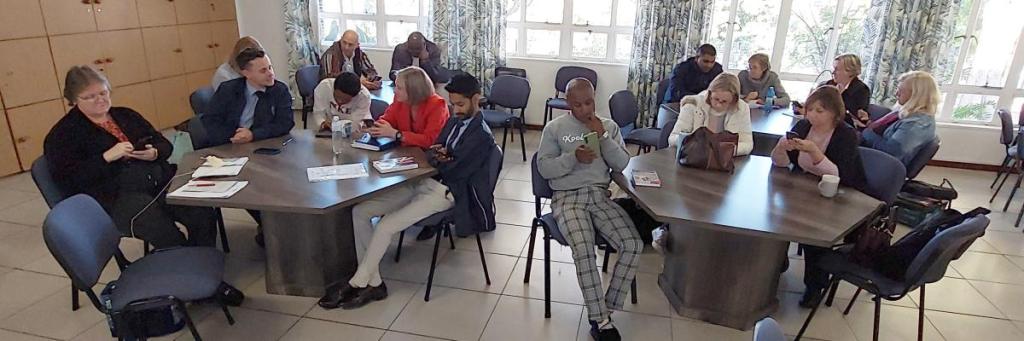
Subject heads logging into their private page on the EASTER Action website.
Multiplier workshop
Apart from expanding environmental education within their own school, Kloof High also expressed a wish to increase their environmental activities in the wider community.
It was time to test the ‘Multiplier’ concept, which takes the ‘train-the-trainer’ idea one step further: yes, empower educators to engage their learners, but then also empower learners to engage their families. By introducing activities that involve real-life activities in the home environment, we hope to spread knowledge and know-how way beyond the immediate participants, building climate literacy, and hopefully stimulating citizen climate action in the wider society.
Each participant received access to the videos and activity guides for the first four units, to use with their learners, via a private workshop page on the EASTER Action website. We have set up various feedback forms, to harvest comments and experiences, and we look forward to finding out if this approach works. Ultimately we hope that showcasing what others are doing will help motivate engagement and participation. It is a work in progress.
The workshop was attended by 11 amazing people: 2 school teachers (Hillcrest High, St Mary’s) and 9 environmental educators (including from WESSA, Wild Trust, Umkhumbane Schools Project, DUCT).
Feedback from participants: The small group format was much appreciated, as it gave everyone a chance to meet properly, network and hear about what others are doing. It also allowed ample time for questions and discussion. The programme content was described as “outstanding, especially with the short videos for each section… clear and easy to understand… useful… well-presented… Having the chance to go through each of the highlighted modules, watch the videos, and try the activities, was very beneficial… The activities were very useful in giving me ideas on how to better facilitate a lesson on climate change.”
Participants suggested keeping future workshops short and small, and also providing teaching tools (activities and videos) that speak better to younger learners at their level. The current content is aimed at high school learners, and is also suitable for grade 6&7.
Thank you everyone who came and made this such a memorable and pleasant day! And thank you Corné for your passion, and Kelly for your help with the organization!
The wonderful participants of Multiplier Workshop ‘Aardwolf’ – hopefully the first of many.
The details may be complicated, but the conclusion is not: PV works.
The biggest hurdle for many remains the cost – despite tax breaks and the lowest-ever prices. Before ‘splashing out’, they want to know: Does solar power really work? Money-wise and otherwise?
Next month is World Energy Day (22 October). I hope this blog will help some who are still unsure about PV, make a positive decision.
Design
Various suppliers and websites can help you design a system that matches your lifestyle, your needs and your budget.
We were lucky to have an expert friend, an electrical engineer who was involved in the design and construction of the de Aar solar farm. He gave us an initial design, along with all the numbers. His calculations included many engineering details, such as hourly data on solar irradiance (how much energy shines from the sky), based on the local latitude and altitude, and how much is collected by the panels, based on temperature, windspeed, albedo, and the angle and orientation of our own roof. After accounting for various losses, you get an estimate of the actual DC voltage generated by the panels, and the final AC power you can expect to get out of the system.
We had saved up for solar power, and were willing to spend a bit extra to get the most out of it.
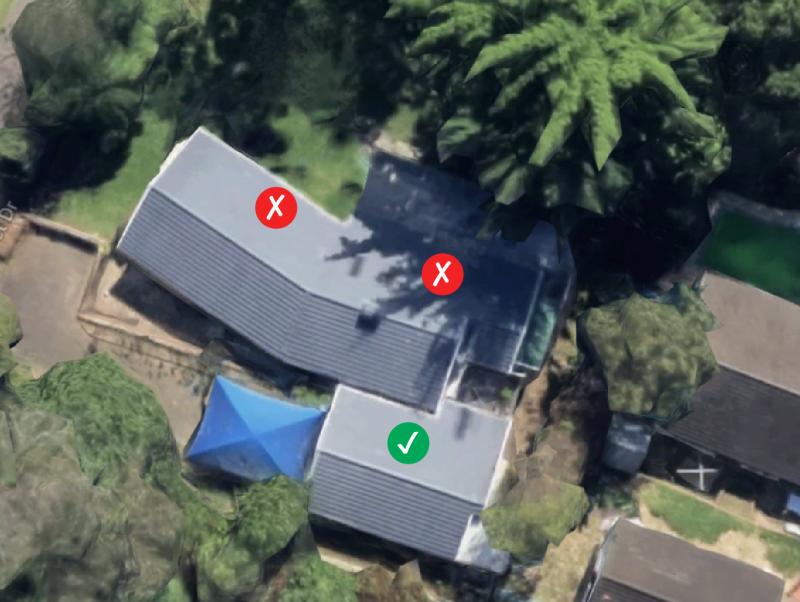
Panels: We installed our panels on the garage roof, as it was most north-facing, with the least shade. The panels are the cheapest part of the system, so we decided to install as many as would fit on the roof (17 panels).
Batteries: We did not consider a solar system without batteries. Apart from reducing our carbon footprint, power storage was the main attraction. Despite the price tag, we decided to get two 5kW batteries. We felt that the extra investment would pay itself off in avoided grid usage, and would help during loadshedding and longer outages.
This has definitely worked in our favour. Two batteries, once fully charged, supply our needs through supper time until well past midnight, often until dawn – depending on how much power we use in the evening. During the day the batteries help supply the geyser and other power-intensive activities, especially on cloudy days.
Inverter: we decided to spend a few thousand Rands extra on a large 8kW inverter, instead of the standard 5kW inverter recommended for households of our size. We reasoned that with 17 panels, peak power generation would be well above 5kW on a sunny day, and we wanted to harvest this power.
Was the 8kW inverter worth it? In retrospect, no. On a sunny summer day, power production reaches 8kW for many hours. This is far more than we can utilize, and most of it gets exported to the grid (i.e. ‘wasted’ from our perspective, as we don’t get paid for this). The 5kW inverter would simply have capped generation at 5kW.
Power production in mid-winter anyway peaks at just above 5kW, and on a sunny winter day we still have too much, exporting around 30% of the power generated. On overcast days the system never reaches the 5kW limit. So… a 5kW inverter would have sufficed. If the municipality paid us for the electricity we export, it would be a different story. Lesson learned.
This blog by the editor of TechCentral, has other useful details on the design side. A ‘solar for dummies‘ article by one of the solar company is also helpful. (We went with another company and were very happy with their service.)
The system flow chart as displayed on the inverter screen.
Wiring
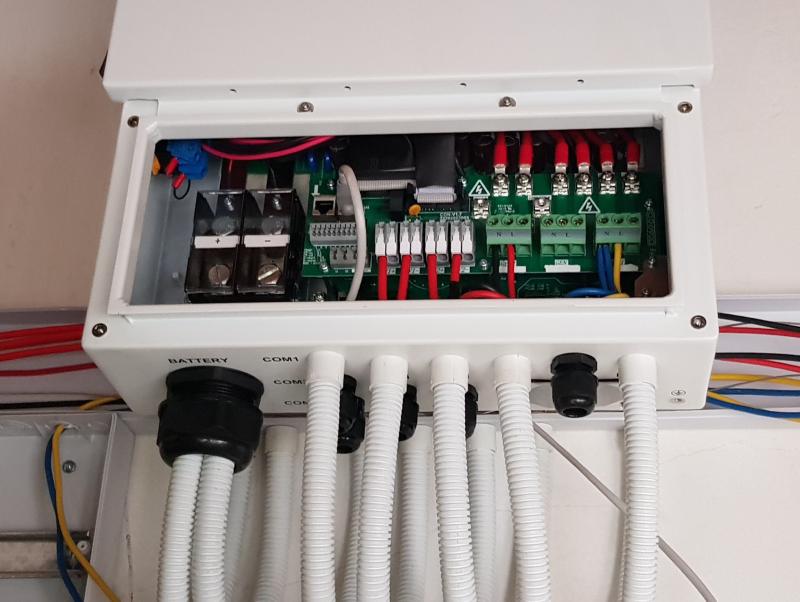
If you install PV power, while remaining connected to the grid, the distribution board has to be split into ‘essentials’ (powered by PV during grid outages) and ‘non-essentials’ (not powered by PV during grid outages). The main decision is what is ‘essential’ and not.
We were advised to wire the geyser, stove/oven and pool pump to the ‘non-essential’ section. That is because together they can draw more than 8kW – the limit of what our PV system can supply. Over-loading the inverter would cause the system to trip.
We also decided to put the granny flat on the ‘non-essential’ circuit, because we cannot control what tenants do during loadshedding, and this might cause unnecessary conflict.
What does this mean in practice?
When the grid is available, everything is connected and can be powered by the PV system, even the ‘non-essential’ circuits. If ever the total load exceeds the 8kW limit of our PV system, the grid supplies the excess.
However during grid outages, the ‘non-essentials’ are not powered: the pool pump doesn’t run, the geyser doesn’t heat and the stove doesn’t work (even when there is plenty solar power).
Ok, so the geyser simply catches up when the grid comes back online, drawing on the PV system as before, and we don’t notice loadshedding in that regard. However I found it annoying to have no stove during loadshedding, when I could be running it on solar power.
So we got an electrician to install a special switch, allowing us to connect the stove/oven to the ‘essential’ part of the DB temporarily. We just have to be aware, and not use too many appliances at the same time, and then switch the stove back to the ‘non-essentials’ afterwards. This was a brilliant idea.
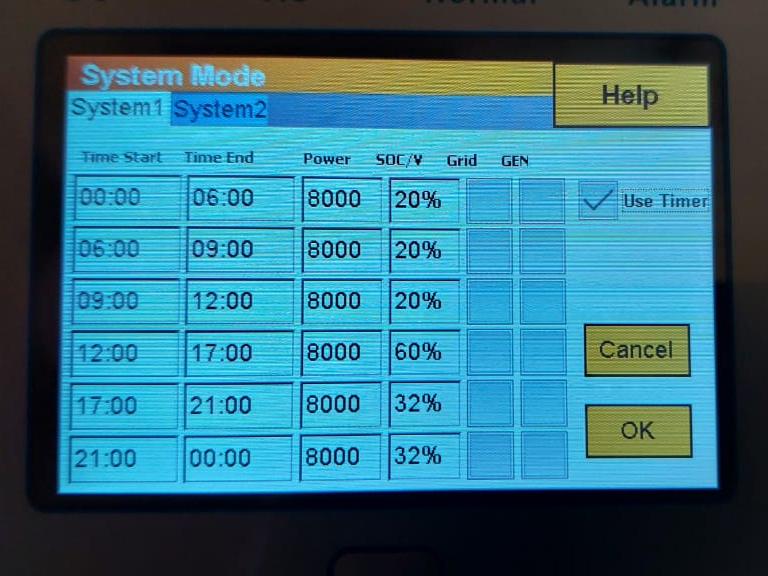
Settings on inverter
Another decision point is how to program the inverter. Like, whether to export or not, whether to charge the batteries from the grid, and especially, how and when to use the batteries.
You don’t want to run the batteries flat, as this reduces their lifespan. In fact, it is advised not to run batteries much below 20% charge. So one should program the inverter to switch off the batteries when they reach 20%.
We also made the decision never to charge our batteries from the grid, only from solar power. Converting grid power to battery and back just wastes energy. We can always get by until sunrise.
During periods of loadshedding, our inverter is set to run batteries down to 20% after midnight and during the morning. But between 12h00 and 17h00 the system will not let the charge drop below 60%, to ensure there is enough charge left for the evening. If by 12h00 the batteries have not to 60%, it’s a bad solar day. On such overcast days we would rather use the grid in the afternoon, and keep the batteries for later, in the case of loadshedding. After 17h00 the batteries may drain to 32% until midnight, and to 20% after that.
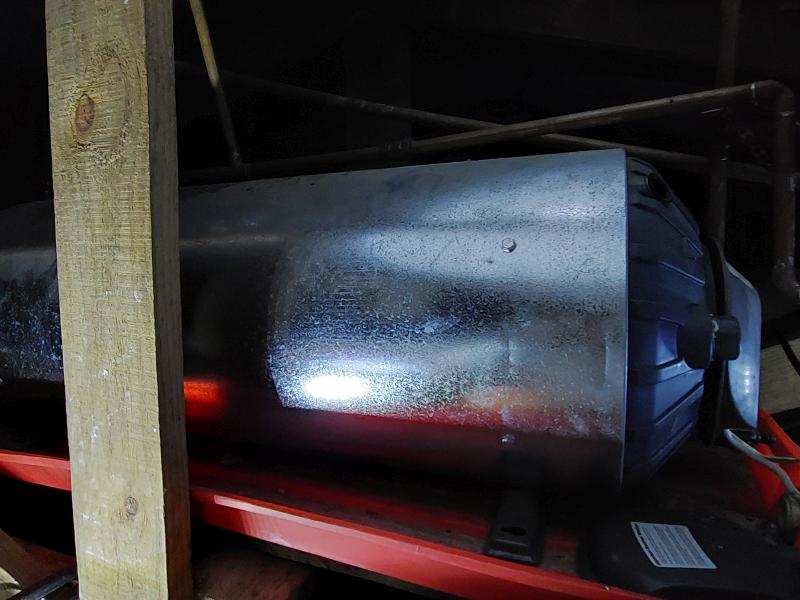
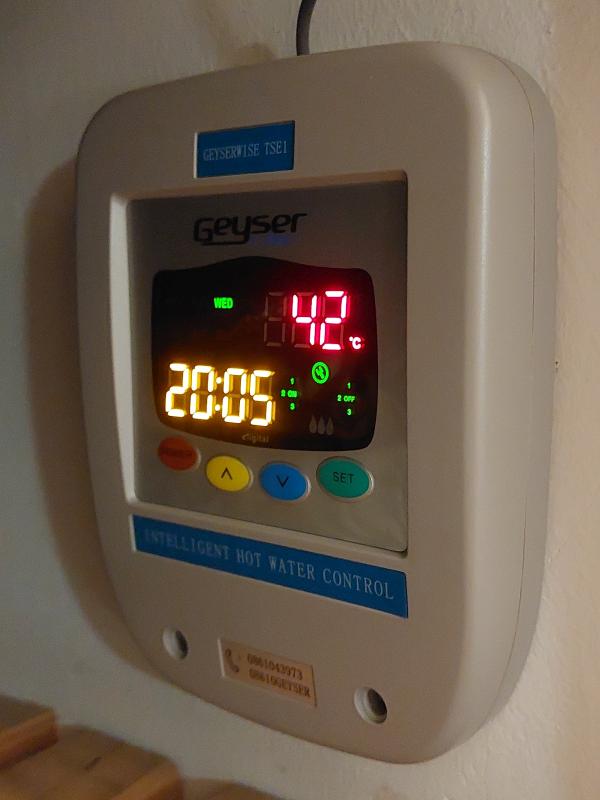
Geyser controller
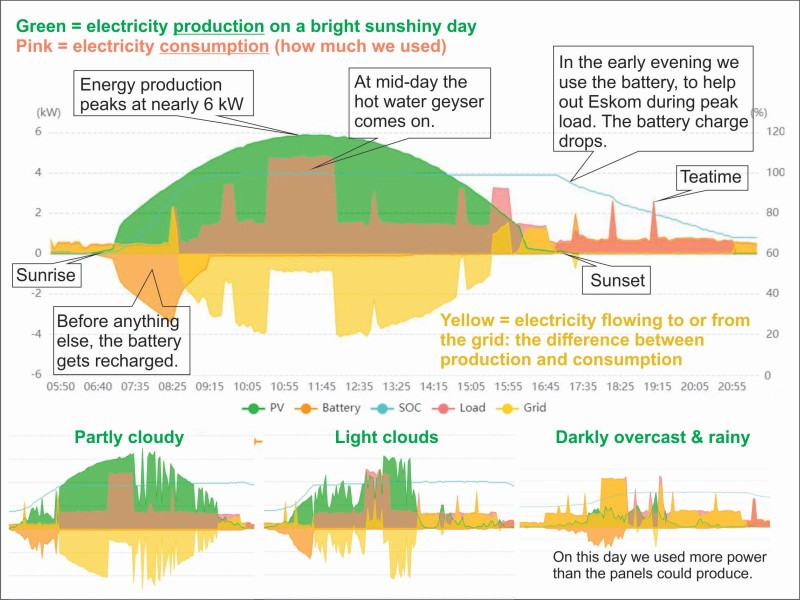
The geyser draws a huge amount of power, and we avoid using the grid for this, if possible. A digital geyser controller turns on the geyser during peak daylight hours. Keeping it heated all the time would be a complete waste.
Our geyser is set to come on at 10h30 heating to 55°C; and again at 12h00 heating to 65°C. This is enough for up to four hot showers in the evening. Spreading the heating over two periods gives the batteries a chance to charge as well, especially on partly cloudy days.
In the early morning hours the geyser comes on briefly to top up the temperature to 45°C, for one hot morning shower. Usually the water is still warm from the previous day and it heat for 10 minutes or less.
On weekends the settings are slightly different. We keep tweaking the timings to minimize our grid usage.
We also finally installed a geyser blanket, which cost all of R300, to reduce heat loss in winter.
Bare geyserGeyser blanket installedGeyser controller
Behaviour
Installing solar power was only the first step. Then we had to learn how to use it.
In the beginning we got on average 60% of our electricity from the solar system. Now we are getting over 80%, from the same system.
We have learned a LOT. From the graphs generated by the PV app we have become very aware how much electricity different activities and appliances require, how much power is generated in different seasons and weather conditions, and we have learned how best to utilize it.
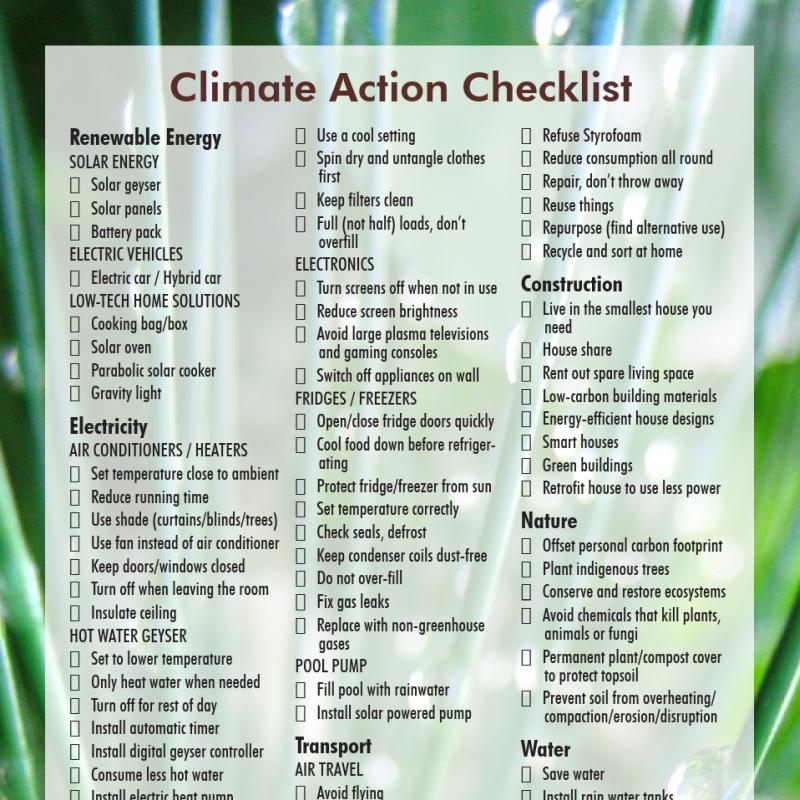
We have shifted energy-intensive activities to daylight hours: washing machine, dishwasher, or when necessary, the tumble drier. We also use many of the electricity saving methods described on the climate change booklet checklist. It just becomes a way of life.
The pool pump draws a lot of electricity (yes we have a pool, eish!) We use a simple manual timer, set to the brightest times of the day: in summer it runs from 8am to 4pm, in winter from 10am to 2pm, which is enough to keep the pool clean. On overcast, bad solar days we turn the pool pump off.
Power generation and use
Through the seasons, days get shorter or longer, more sunny or more cloudy. Our best solar month so far was January 2023 (1124kWh generated), the worst was May 2023 (480kWh) – which had lots of cloudy weather and short days.
August-December 2022
January-June 2024
Comparing monthly graphs from 2022 with 2024, the amount of solar power generated (‘PV’ – green bars) remained around 800kWh per month, regardless of time of year. Our home electricity usage (‘Load’ – pink bars) was also fairly constant, between 600 and 700kWh per month.
However the amount of electricity exported to the grid (light orange bars), was a lot more in the beginning (400kWh), down to 240kWh per month now (meaning we now throw away less of the power that we generate).
The amount imported from the grid every month (dark orange bars), which we had to pay for at the usual rate, decreased from 280kWh to 120kWh per month, more than halving our remaining electricity bill.
In other words, in 2022 our solar system supplied 58% of our electricity usage, in 2024 it supplies over 80% on average.
How? Partly by making the various adjustments described above. But mainly by using our batteries throughout the day. In the beginning we only drew on the batteries at night (or during loadshedding), not otherwise. Now we use them whenever demand (load) exceeds PV generation.
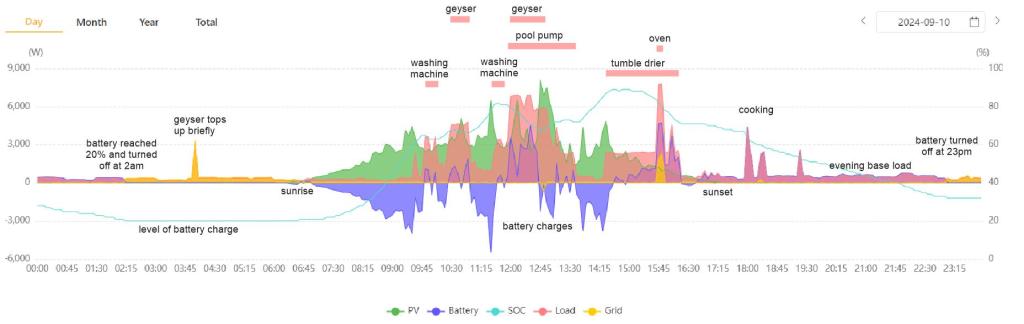
On this partly cloudy, busy day, the solar system nevertheless supplied most of our needs, which included two loads of washing, geyser, tumble drier, dishwasher, a few hours of pool pump, baking and cooking. The battery is alternatively charging and discharging throughout the day, never reaching 100%. It ran out before midnight. No power was exported to the grid on this day.
Despite the partly cloudy weather, 90% of our electricity usage on this day was supplied by PV (Import/Load), only 10% was imported from the grid.
Economics
Does solar power make financial sense? Yes.
In 2022, our electricity bill would have been on average R1600 per month, based on our usage. That first year we paid only R670 (imported from grid), thus saving R930 a month (58% savings).
In 2024 electricity would have cost us R1880, but we paid R350, saving R1530 a month (81% savings).
In total so far we have saved about R30 000. We could have saved more based on what we know now.
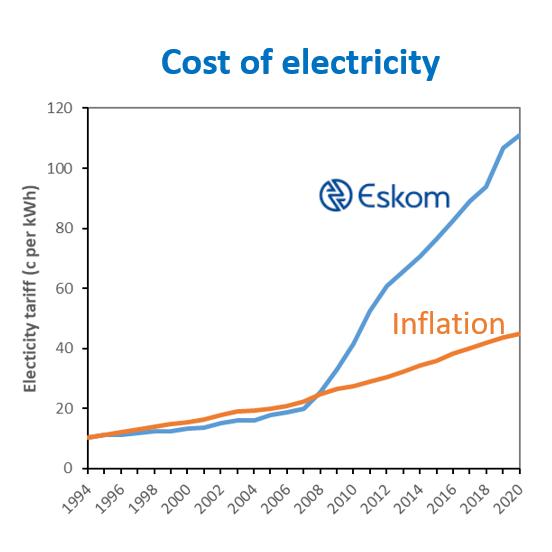
Our system cost around R210 000 to install in 2022. If we assume inflation remains at 6.4% (the average over the past 2 years), and that electricity prices increase at the same rate, the savings would pay off that amount in 10 years. However for the past 8 years electricity prices have increased by 12% every year, double the inflation rate! If this trend continues, total savings would reach R210 000 in just over 5 years (not considering the interest earned).
As mentioned, we had saved up for it, and paid in cash. Had we put the expense on our bond, the savings would pay off the expense plus interest, after about 12 years, without putting in a cent extra.
Embedded rooftop solar PV
When you install rooftop solar, you have to register – here are the guidelines.
In our experience, until our system was registered, the municipality continued to bill us at our pre-PV consumption levels, despite repeated confirmed meter readings.
Once our registration went through, the municipality came and installed a bi-directional meter. Our excess payments were then credited back to us (not paid out in cash), against our monthly bills.
Do you get paid for power you export to the grid?
Yes and no. eThekwini municipality allows embedded power, at least in principle. But in our case it makes no financial sense. Here’s why:
Currently, we pay R 2.97 per kWh, with service charges built in, same as everyone else. If we wanted to earn money on our exports, we would have to sign up for the Feed-in Energy scheme. However, the price structure is not in our favour.
According to the 2023/24 tariff booklet, we would earn R1.44 per kWh (similar to what the city pays Eskom), but we would have to pay an ‘Ancilliary Network Charge’ of R126.86 per kVA (based on the inverter size). On our 8kW inverter that would amount to R1015 a month. 1015/1.44=705.
In other words, we would only start earning on exports above 705 kWh, which is more than we export currently. So for us the feed-in system makes no sense financially – we would spend more than we would earn.
So we simply donate surplus electricity to the city (rather than dumping it) – say ‘thanks’, eThekwini! Subsidizing the city is ok for now, but if too many people pour their excess power into the grid, eventually it runs in reverse, and you get negative electricity prices, which is becoming a conundrum in other parts of the world. (I’m sure there is a solution for having ‘too much’ free energy! The market will respond, don’t worry.)
Back to our local situation: with a 5kW inverter, one would start earning on exports above 440kWh, but then we would probably export less, as the smaller inverter would simply cap production at 5kW.
Variable daily rates – with highest prices during peak demand, and lowest prices during low-demand and high-supply periods, can be a powerful incentive for users to shift their consumption. A system like this is in place already (‘Time of use’ fee structure), but the minimum charge of R234.24 again means this only makes sense for high end users and businesses. A variable fee structure would not be fair for low-end users who tend to have less freedom of choice and less flexibility.
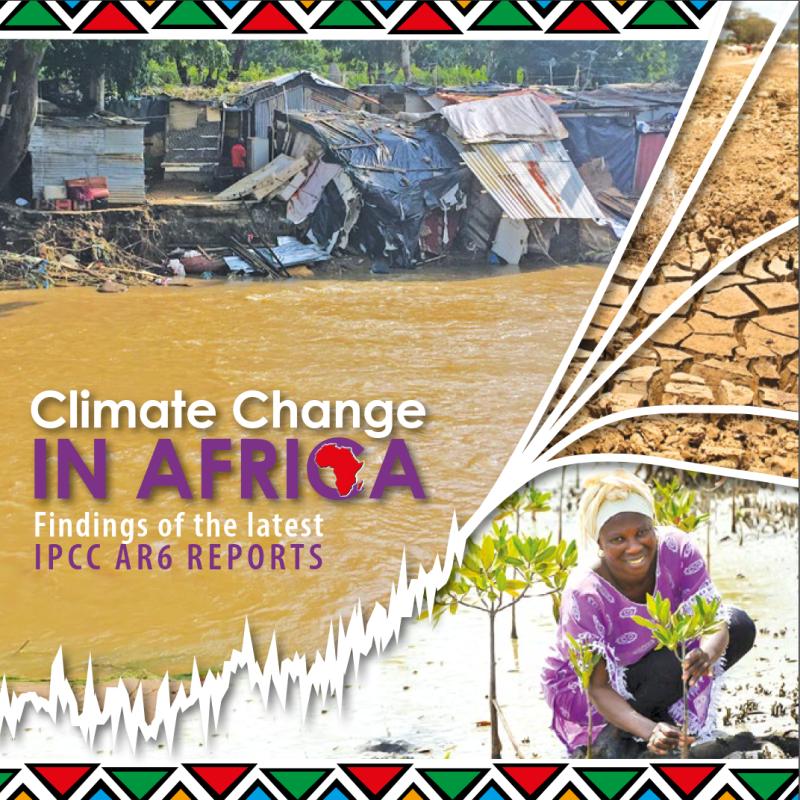
This is just a quick post to publish various links to useful resources on climate change in Africa, to make them easy to refer to in upcoming events and activities.
The information is based on the work of the Intergovernmental Panel on Climate Change (IPCC), which is the United Nations organization that assesses and reports on the up-to-date scientific knowledge on climate change. In my post from World Environment Day 2022 you will find links to some really beautiful videos on the 6th global Assessment Reports.
What do the IPCC reports say about Africa?
The IPCC reports are frankly humungous! They are almost impossible to read, even for scientists who work in the field. Each report has a Summary for Policymakers to help governments make informed decisions. But otherwise information remains deeply buried within many thousands of pages, unless someone digs it out, and interprets it into ‘normal’ English. I smile as I write this, and so will anyone who ever read or wrote an IPCC report.
While working for the IPCC, I and my colleagues (Drs Andrew Okem, Nina Hunter, Michelle North under leadership of Prof Debra Roberts) made an effort to distill key messages for Africa, producing two booklets.
Key messages for Africa in the three Special Reports of the 6th IPCC Assessment Cycle (on 1.5°C Warming; Oceans and Cryosphere; Land)Key messages for Africa in the Main Assessment Reports of the 6th IPCC Assessment Cycle (from Working Groups I, II and III)
We also produced three short videos on key climate change messages for Africa:
What does science say about climate change in Africa?
Climate change in African cities and settlements
Climate change and Africa’s ecosystems
We then produced a booklet on personal climate mitigation in a local, South African context, along with a checklist. This became the foundation for the edu-action programme I’ve been working on since then, under the umbrella of EASTER Action.
These booklets and videos are products of the Durban Office of the Working Group II Technical Support Unit, and not official products of the IPCC. They are not reviewed or endorsed by the IPCC.
The full IPCC Working Group II Africa chapter is of course a brilliant source of scientific evidence on climate change in Africa. The Figures (39 of them) and the Frequently Asked Questions at the end of the chapter are definitely worth looking at. The IPCC released some official derivative products – extracts from the original reports – including regional fact sheets on Africa, by Working Group I (basic science) and Working Group II (Impacts, Adaptation and Vulnerability).
The Climate and Development Knowledge Network has also published an outstanding series of fact sheets on Africa, plus many other super-useful resources, including a number of interesting videos, see https://cdkn.org/resources.
This workshop offers training and resources on climate change, to empower educators to engage learners (and their families), to build climate change knowledge and know-how and stimulate action.
Participants who would like to engage their learners using the resources provided, receive up to 200 climate change booklets for distribution to learners (while stocks last – so don’t miss this unique opportunity). Participants also receive an activity guide and access to online video material.
WHO IS IT FOR? Teachers or other educators of high school-age learners and upwards
The booklet ‘What I Can Do About Climate Change’ was produced by the Durban Office of the Intergovernmental Panel on Climate Change (IPCC) Working Group II Technical Support Unit* (free download). The booklet was prepared to increase the accessibility of IPCC science to help inform personal climate action in Durban.
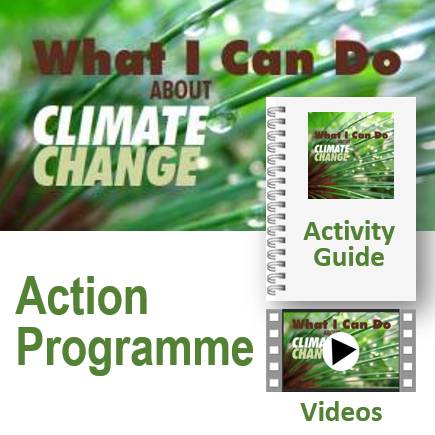
The What I Can Do (WICD) Action Programme* was developed by the lead author of the booklet (Marlies Craig) to increase active engagement with the booklet. It contains brief lessons (videos), and guidelines for hands-on activities that are suitable for different ages and school subjects. Some are immediately relevant to different parts of the school curriculum. The programme is designed for schools, nature and conservation clubs or educational organizations, adding interest and giving ideas for things to do – in the classroom, on campus, ‘out there’ and at home.
This workshop presents four key units of the WICD Action Programme. In the following months, participants engage their learners (and families, achieving a ‘multiplier effect’) and provide feedback on activities and results. In other words, this is not a workshop that ends when everyone goes home. At a later stage, we hope to host a follow-up Climate Action Expo, where participants can showcase their projects and activities.
*Not an official product of the IPCC. Neither the booklet, nor the programme or training, are reviewed or endorsed by the IPCC.
Disasters strike at random, and catch people off-guard. People also panic when they don’t know for sure what to expect. Disaster readiness and early warning saves lives. Good information can give one peace of mind, as well as the confidence to act.
With climate change, flooding events get more intense and happen more often. On Monday this week, Dubai suffered a ‘rain bomb‘ that dumped a year’s worth of rainfall in a few hours.
Yesterday, after a work-related webinar on climate modelling, a colleague asked if forecasts can “predict the absolute intensity of rain in advance. For instance when we had the floods in January, they knew it was going to rain but had no idea of the volume, and the fact that it was going to happen overnight, instead of spread out over 2-3 days, which would not have caused such damage!”
This question prompted me to write this personal account of the Durban floods in 2022.
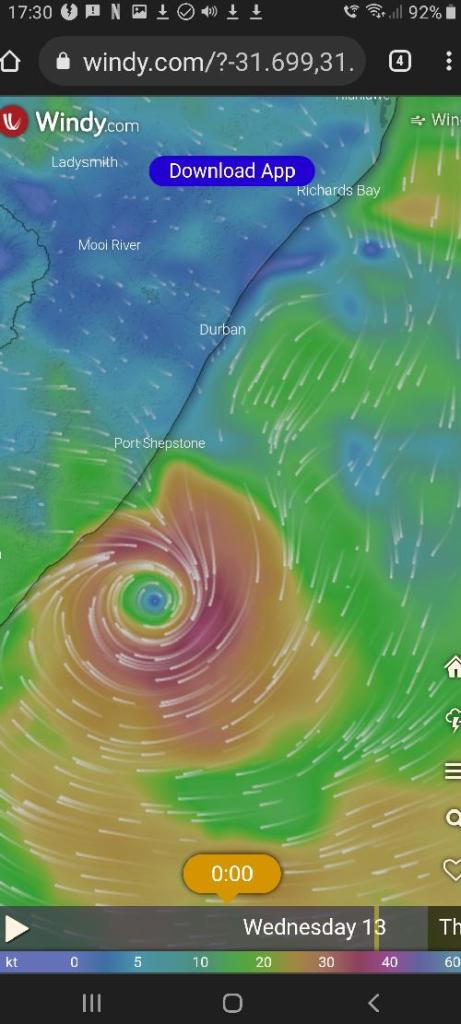
For most of my life I have been fascinated with geography and weather. One day, by chance, I discovered Windy.com. The first thing I saw was a swirling spiral off our coastline, between Madagascar and Mozambique, which puzzled and intrigued me. I shrugged, and almost forgot about it – except that it turned out to be Cyclone Idai, the deadliest cyclone ever to hit our continent.
This is what I saw when I opened Windy for the first time. (Credit: TV Miramar)
I was hooked. Sometimes I simply ‘surf’ the globe, looking at the wind, including the jet stream at different altitudes, or rain, or thunder storms, or ocean currents. I have also started using these online forecasts to inform the neighbourhood via our chat group, and so became known as the ‘weather woman’.
Trying to stop the water coming in the front door (arrow shows water level)The damage in our neighbourhood was quite severePrecarious housing on steep slopes or below the flood line, with no formal town planning and infrastructure, are at extreme risk.
Our family are fortunate enough to live in a brick building, and suffered minimal damage. But the hundreds of thousands who live in precarious houses and shacks can lose their entire livelihoods in a single day.
Afterwards the big question was: did the weather forecasts not see this coming?
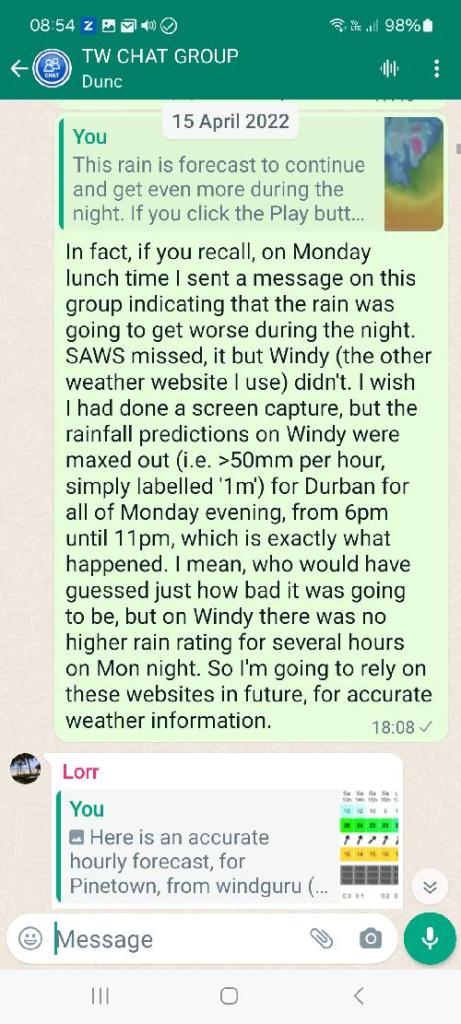
In fact, Windy.com did see it coming, very clearly. The rain forecast on 11 April was completely maxed out, showing the highest possible category. By late morning it was predicting 50-100mm per hour, from 6 to 11pm that evening. It turned out to be uncannily accurate, the rain fell exactly as predicted.
At lunchtime on 11 April, I posted a warning on our neighbourhood chat group (amidst typical dark South African humour).
I urged my husband to leave work early. But by the time a meeting ended, they were already stranded and had to be evacuated.
The next day the system moved 50km South, dumping water on the Port Shepstone area. It turned briefly into a little cyclone, then dissipated.
I had not used Windy in this context before, so my warning was worded simply and carefully, referring folks to the original source. I did not consider then that everyone would not be familiar with such an app, be able to interpret it, or even have sufficient Internet access.
The South African weather service (SAWS) had failed to issue serious warnings, which was embarrassing to say the least. An event of this magnitude should have rung all the alarm bells.
On 12 April, a belated Media Release from SAWS pointed out that “at 16h00 yesterday, a Level 5 warning was issued” and that this “was subsequently escalated to a Level 8 warning at 20h00”. They also claimed that “the exceptionally heavy rainfall overnight and this morning exceeded even the expectations of the southern African meteorological community at large.” There were explanations of what “orange level 9”, “yellow level 4” and “orange level 6” warnings mean, but I find this mix of colours and numbers quite confusing.
“Could this rain system be attributed to global warming and climate change?” the article asked, then gave a difficult-to-understand and misleading answer: “No, as weather scientists we cannot attribute individual weather events occurring on short timescales …” and so on. The last sentence of the paragraph finally admitted, “…heavy rain events such as the current incident can rightfully be expected to recur in the future and with increasing frequency.”
That last sentence should have come first. Why? Because people need to know this, we need to address climate change, urgently. (And it should have been translated into plain English: There is very a good chance that this disaster would not have happened, or would have been only half as bad, if it wasn’t for climate change. And that is the truth.)
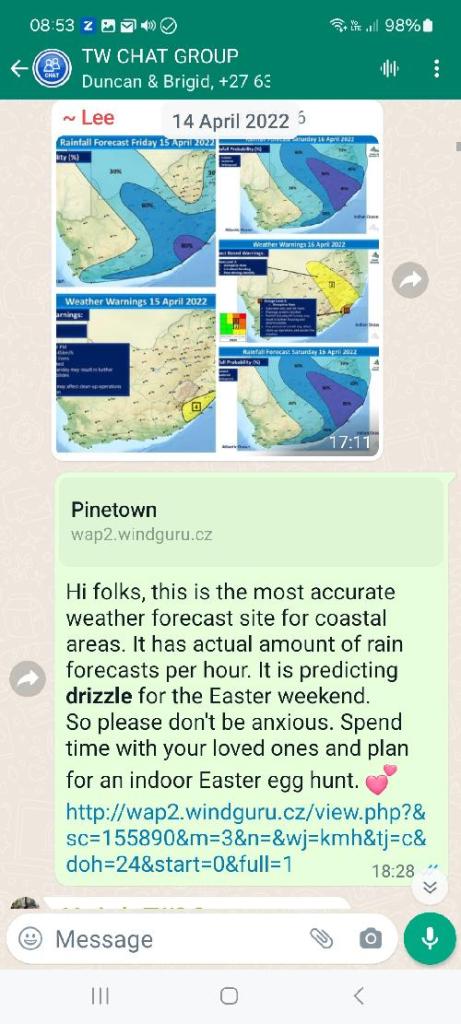
When it started raining again two days later, SAWS was on high alert and issued a level 5 orange warning for our area with “possible localized flooding”. A weather forecast circulated on social media, which described the 11 April flooding disaster, as “quite significant amounts of rainfall.” Huh? Pardon? So… what exactly does ‘level 5 orange’ mean then? Gear up for another disaster?
Meanwhile, both Windguru and Windy were predicting only light rain, so I reassured the neighbours, and recommend a peaceful weekend with indoor Easter egg hunts. It was a non-event.
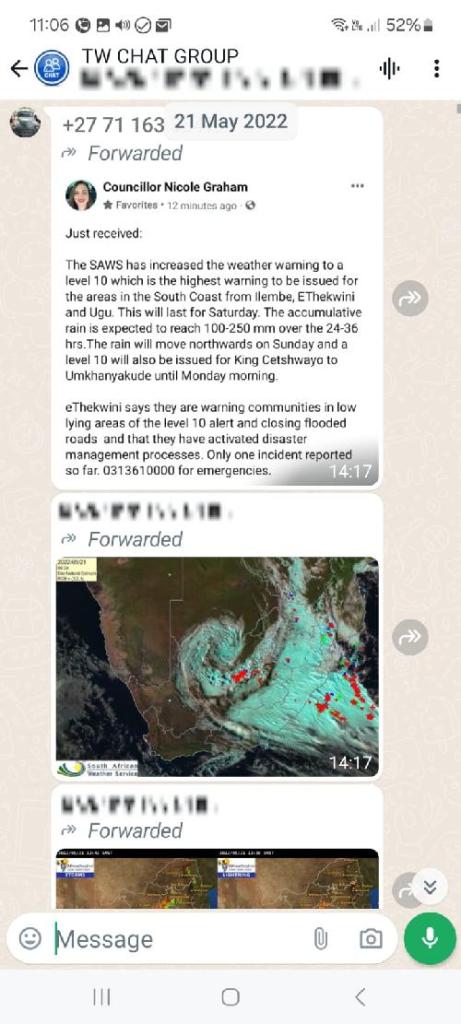
Of course, a few weeks later, on 22 May, we did have another flooding event! This time SAWS released a dire level 10 red warning. (What does ‘level 10 red’ mean? – compared to the April floods?) Now people were worrying: was this going to be even worse? Some folks had gotten badly flooded, and were panicking. The social media went crazy and people didn’t know who to listen to. Many folks in our neighbourhood have smartphones, but can’t or don’t access the Internet. Even if they did/could, where exactly would they look? They rely on forwarded information.
A local councillor sent out a warning. People forwarded other bits of scary information.
My detailed, local forecasts gave people “peace of mind”.
Once again, based on Windy.com, I calmly provided regular updates. And suddenly, the sun came out.
So, a big question for me is: if Windy.com was able to predict the exact timing and amount of rain, why did the SAWS forecast system get it so wrong? I also don’t find those generalized warnings with colours and levels very helpful. Personally. I want to know how much it will rain, when, for how long. When it rains, I want to know if it will get worse or let up, an hour later. Then I can judge. I can look outside and decide. But maybe other people want to know other things.
And then, how does this informationfilter down to the people? I don’t know how it works. I’m sure information on a computer has to pass through the climatologists whose job it is to keep an eye on the predictions, through levels of management, through broadcasting stations, through journalists and editors, to finally end up on people’s TVs and phones for instance, in a useful format and with meaningful content.
How do the numbers and maps get translated? What pictures, colours, numbers and words are used? How do you make it meaningful in real life? What happens when messages get translated into other languages? How are message communicated? Who says what, when, how often, where and how? How is information interpreted and transmitted? Through which media? Who sees, reads and hears it? How, where and when is it passed along? By whom, to whom? At what time? How accurately are messages passed along? How are they understood? Is the information trustworthy? And is it trusted? Do people know how to respond? And then, do they act on it?
Science considers type I (alpha) and type II (beta) errors. Type I errors are ‘false positives’: raising a false alarm when there’s nothing to worry about, ‘crying wolf’, believing a falsehood. Type II errors are false negatives: missing a real warning, failing to raise alarm when there really is something to worry about, missing a truth.
One can see both types of errors in the Durban floods: first a lack of warning of impending disaster, so people say “Why didn’t you tell us?” followed by over-reaction, so people say “That wasn’t so bad, what was all the fuss about?” Both types of errors erode trust.
What about liability? After a deadly flooding disaster in July 2021, in the Ahr Valley, Germany, local authorities had come under investigation “for negligent homicide and negligent bodily harm as the result of possibly failed or delayed warnings or evacuations of the population”, for acting too late in sending flood warnings. Two days ago, the investigation was finally dropped because “it was an extraordinary natural disaster” that “far exceeded anything people had experienced before and was subjectively unimaginable”. Is this sufficient reason to escape liability in a warming world where disasters are coming ever faster and harder?
Looking back over the past 20 years or so, with our weather fetish, my hubby and I had been consulting a website called Windguru, a simple, utilitarian service (started by a Czech windsurfers of all people!) This used to produce incredibly accurate forecasts (originally only in coastal areas), predicting exactly how much it would rain, and when, down to the hour. Based on this we would plan camping holidays, time hikes, and decide when to wash clothes.
I say ‘used to’, because these past few years I have the impression that it has started to underestimate rainfall – in our province at least. In years gone by, <1mm was reliably ‘light drizzle’ or negligible spots of rain. Now we regularly see proper, driving rain, when <1mm is forecast. This is totally anecdotal, but I wonder if the weather models are perhaps not able to keep up with climate change?
At the same webinar that I mentioned earlier, someone asked, “What can we do to help the most vulnerable, people living in shacks, in valleys below the 100 year flood-level, people who won’t want to flee because their entire livelihood is at stake?” Research is being done in this critical area, for example on the Quarry Road Informal Settlement in a flood plain. We need solutions, and quickly. The next flood is just around the corner.
That’s where I leave it. My scientific brain cells are whirring and wondering. I have no real answer, only lots of questions. Sorry.
On 16 March, the Wildlife and Environment Society of South Africa (WESSA) Eco-Schools celebrated the transformative impact of the Eco-Schools programme in South Africa. The KwaZulu-Natal provincial award ceremony brought together teachers and learners to recognize two decades of environmental education.
Margaret Burger (centre) honoured for her outstanding contributionThe Birches Pre-Primary School receive their well-earned emerald award
EASTER Action would like to congratulate WESSA, the Eco-Schools programme, and particularly, this year’s recipients of notable awards: Epworth School and The Birches Pre-Primary School in KZN, for consistent environmental action over 20 years, plus the 40 schools from across the country, who received International Green Flags for their outstanding environmental efforts. Well done! Heart-felt congratulations also to Margaret Burger, who was honoured for her longstanding dedication in this area!
The organizers had asked me to do the keynote presentation, which was a wonderful opportunity to try out the pilot session of the What I Can Do (WICD) action programme with this audience of teachers. Based on observations and feedback, they found the interactive presentation as interesting and engaging as learners had done previously. This bodes well for the teacher workshop we are organizing for the near future.
Which sector produces the most greenhouse gases? A visual wow! momentA fun anonymous climate change quiz using Plickers
Today, on World ConsumerRights Day, I make a wish to be able to afford an electric car. I would like manufacturers to stop reserving this innovation for the luxury niche, and produce models for the mass market. It looks like my wish may start coming true soon.
Last week I met a person who was adamant that electric vehicles (EV) are no better than ordinary cars (with combustion engines). I felt so helpless against their firm belief in this misinformation, and decided a quick blog on this was in order.
There is plenty of evidence that EVs are a huge improvement, from the the US EPA debunking ‘EV myths‘, to the detailed scientific account of the IPCC Working Group III chapter on Transportation. EVs win hands down – especially when charged using renewable energy (such as solar power or wind).
An ICCT report shows life-cycle emissions from different kinds of mid-sized cars registered in Europe. The graphs for other countries look very much the same.
Full life-cycle analysis takes account of greenhouse gas emissions of a product, during all stages of its existence: manufacture, storage, transport, retail, operation while in use, and finally scrapping or recycling – including powering and supplying all the raw materials and processes along the way.
Battery technology is also progressing rapidly – watch this space. The perceived issues with Lithium-Ion batteries will soon be moot. The more we invest in EVs, the more research and development will happen, and the sooner we’ll see even better solutions.
Having said all that, I must now confess that owning and driving a car is an environmentally unfriendly privilege for those who can afford it, that should eventually be phased out. Manufacture-related emissions are still considerable, and electric private cars are not the solution for a climate-resilient future. To achieve net-zero-emissions, electrified public transport is the way to go – of course fueled by renewable energy.
However, EVs have another potential use: vehicle-to-grid technology is an emerging solution to help solve the problem of variable power supply from solar and wind, providing power stability to the owner or even to the wider grid. EVs are plugged into the grid whenever they are not in use, adding to the total power storage capacity. They store excess power when available, and help supply the grid during high demand periods.
UPDATE (22 April 2022): in a recent article “The search for South Africa’s lost electric car“, the Daily Maverick reveals that already back in October 2008 an electric vehicle (the Joule) was unveiled at the Paris Motor Show. Full-scale production was supposed to start in 2012, “with cars in showrooms by mid-2013”. ‘Van Van’ replied that they saw the Joule displayed at Cop17 in Durban: “It was beautiful.” Jeffrey Barbee shared a link to a video:
This is so amazing! But for some reason the Industrial Development Corporation of SA pulled out, the government refused to provide funding, the idea was scrapped. Apparently one out of the four fully functional cars still survives. Now I feel deeply depressed that 11 years ago South Africa missed such an incredible opportunity.
Nearly a year ago, the opening session of the What ICan Do (WICD) About Climate Change Action Programme got piloted at a local high school. The introductory session is designed for really large groups, such as an entire school assembly.
Before even mentioning ‘climate change’, the programme starts by introducing young climate activists, showing the role that the youth play in world affairs. It encourages learners to think at the global scale, rather than just thinking about ‘me, here, now’. Climate change is a global problem and we are world citizens. This introduction hopefully arouses a sense of importance, relevance, empowerment, and capacity: “Look what others have managed to do, we can also do something!”
Climate change has been called a ‘wicked problem’: so complex, with so many interacting causes and symptoms, that it seems impossible to solve – or at least wickedly difficult. ‘Wicked’ means evil, and climate change is that. But in slang ‘wicked’ also means excellent, brilliant. The ‘wicked’ problem of climate change needs ‘wicked’ solutions. The acronym WICD fits perfectly.
So where does one start? We want to start with actions that are easy to do, that have a big impact quickly, and we want to involve as many people as possible. That is the key message of the first session. The second session – with related activities – does just that. It is designed for smaller, class-room sized groups, and involves the learners’ families back home.
We are now planning to pilot the first two sessions with a group of educators, who will then involve their learners and their learners’ families.
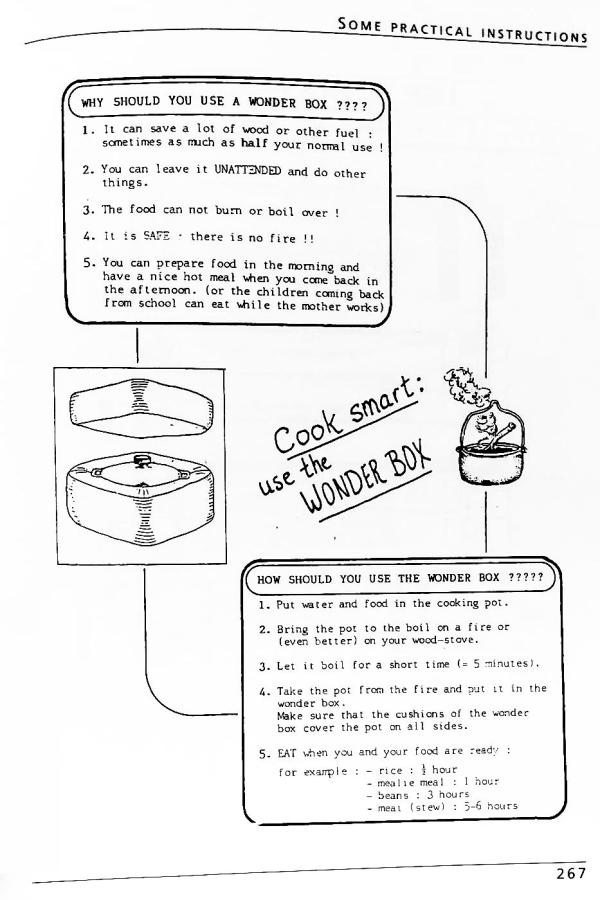
Cooking in a hot box / hot bag saves electricity while reducing our carbon footprint. Food takes only slightly longer to cook than on the stove, and can be left unattended (it doesn’t burn or boil over, and doesn’t need to be stirred).
I even find that stews and soups cooked like this tastes better and more fragrant. Rice is more fluffy and evenly cooked.
A hot bag can also be used to keep things cool – more efficiently than a cooler box.
This is the kind of hot box / wonderbag / hay box that one can buy, promoted here by the Department of Economic Development, Tourism and Environmental Affairs.
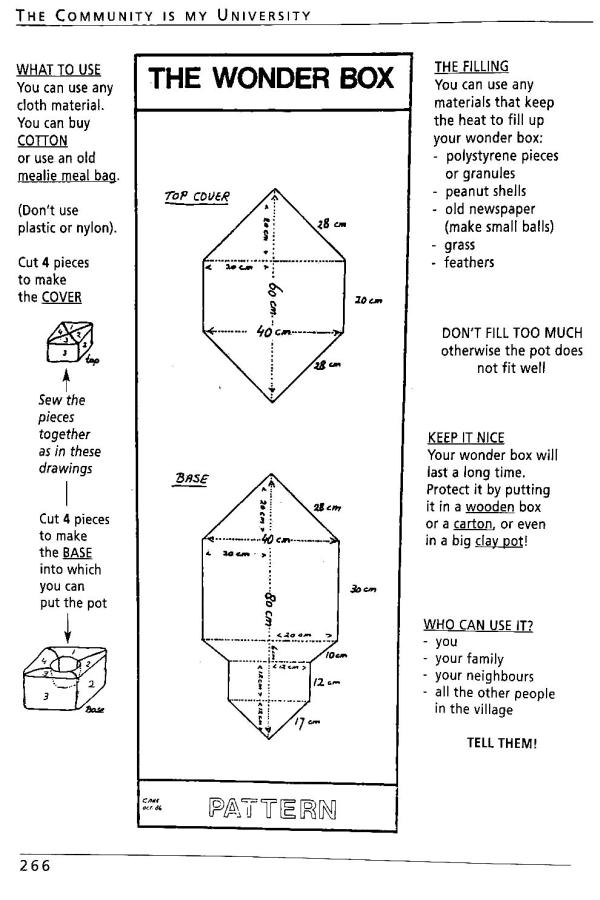
This beautiful book on community development and rural health, has instructions for rural women on how to make a ‘wonder box’ out of old cloth such as old linen mealie meal bags and stuffed with insulating peanut shells, grass, feathers or old newspaper.
You don’t need a box at all though. Some warm blankets work just as well. Hikers know this trick: you only need one little gas cooker for a 3-course meal. Boil a pot of rice, wrap it in your sleeping bag, then prepare your soya mince sauce (which cooks much better, without burning, in another sleeping bag), while you cook the dried vegetables (or make a nice cup of Milo).
Hiking and camping at Mont-Aux-Sources in the Drakensberg.
At sea level, water boils at 100°C. For every 300m rise in altitude, the boiling point of water is about 1°C lower. So at the top of Amphitheatre, at 3200m, water boils at 89°C. At high altitude food simply takes longer to cook – just something to keep in mind.
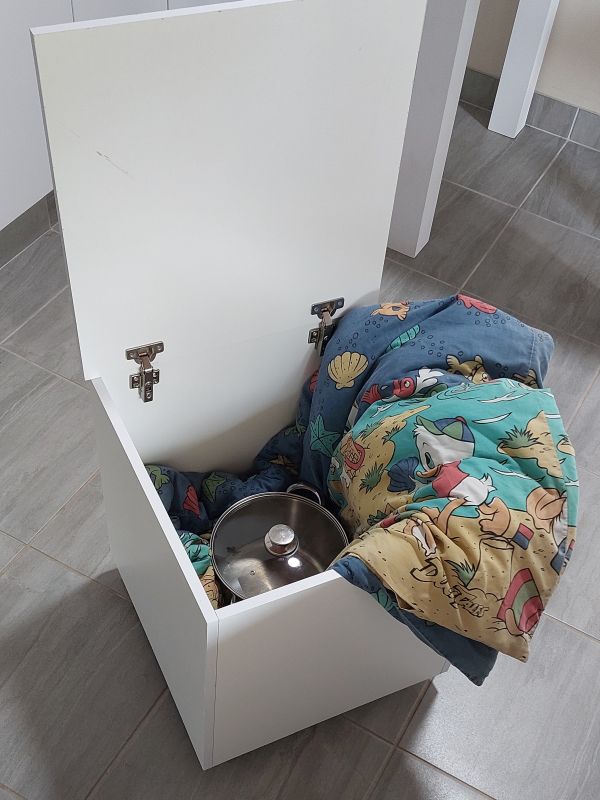
For my kitchen I recycled an old kiddies’ duvet that had gotten lumpy. I use this regularly to cook rice, stews, soups – anything that otherwise needs prolonged simmering on the stove. It really helps during loadshedding: as long as I get the pot boiled before the power goes off, no problem.
I got this fancy solid box made, on wheels, with a lid. It goes under the table, serves as a seat, and when needed, it comes out and becomes an oven.
How much electricity (and carbon dioxide emissions) does a hotbox avoid?
That depends on the kind of stove we are comparing it against, and the kind of food we are cooking. Since one needs to bring the food to the boil either way, the hotbox only saves on the simmering time. Food that only takes 15 min to cook on a stove would save only a little electricity; food that has to cook for hours, saves a lot. So the cooking box is particularly useful for meals that require longer cooking times.
1kWh electricity produces approximately 1kg of carbon dioxide emissions.
For those who like actual numbers, Eskom reports that it produced 198 281GWh of electricity in 2022, with 207.2Mt carbon dioxide emissions (plus 32.90Mt ash and 66.65kt particulate matter). Converted that is 198,281 million kWh and 207,200 million kg. Divide kg by kWh to get emissions per energy used.
A typical 1000W stove plate, if set to maximum heat, would use 1kWh per hour, and produce 1kg of carbon dioxide in emissions. So let’s say you simmer food (on level 3 out of 6) then you can assume a typical 1000W plate will consume approximately 0.5kWh per hour on half heat, which equates to about 0.5kg carbon dioxide. Now do that every day. Perhaps you use more than one stove plate at a time. All that adds up very quickly.
Please have a look at the total kWh on your last monthly electricity bill, and multiply that number by 12 to get the number of kg of carbon dioxide your household adds to the atmosphere every year. Now think: you can do something about that. Just dig out an old blanket and start today!
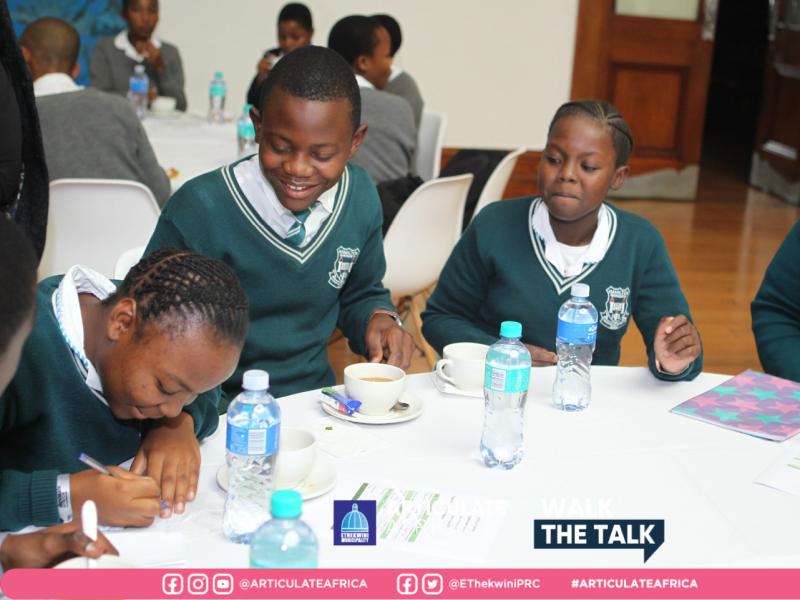
On 19 May I presented at a Climate Change Seminar, under the slogan ‘Walk the talk’. It was part of a three-day-long Articulate Africa Art and Book Fair, hosted by eThekwini Municipality’s Parks, Recreation and Culture Unit. The seminar was attended by around 60 learners from 6 schools, along with around 40 teachers and local stakeholders.
The learners proved that they already know a lot about climate change. They got top scores for quiz questions about what the greenhouse effect is about, about the causes and effects of climate change, and whether scientists agreed on what was going on. Impressive!
BUT, as we reflected before, knowledge does not automatically lead to action. Despite two centuries of climate science, and decades of international negotiations and agreements, government policies are still taking us to 3°C global warming or more. Yet the dangers even of current levels of warming (1.1°C) are clear, just read the news.
The climate crisis is much too serious to wait for governments to act, or to tell us what to do. Instead we, civil society, need to act of our own choice, and put pressure on government and industry to do the right thing. Democratic governments may not listen much to the science, but they do have to listen to the people. So let us ‘walk the talk’.
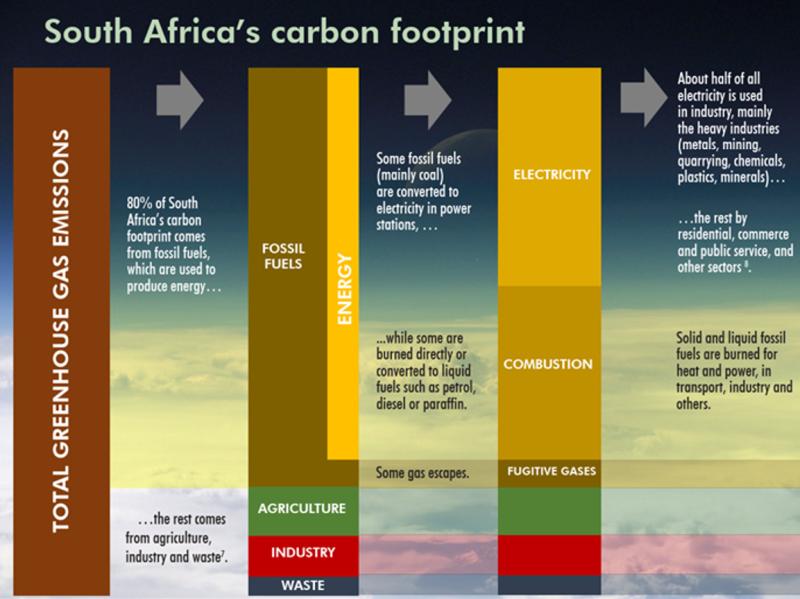
South Africa is the country with the 15th largest carbon footprint in the world. Climate change is not just someone else’s problem, but also ours. Page 6-7 in the booklet illustrates where all our country’s greenhouse gasses come from: 80% come from fossil fuels, about half of which goes to producing electricity from coal. To make a meaningful dent in our national carbon footprint, we need to reduce electricity consumption.
The residential electricity-related emissions can be very high, especially for appliances that are left running for many hours, such as air conditioners, heaters or geysers, and for those that involve heating.
The bar graph (on page 13 in the booklet) shows that electricity use in the home can generate many tons of carbon dioxide per year. How much is a ton?
In an interactive session, the learners at the seminar found out how to read and interpret a municipal electricity bill, and to calculate the electricity-related carbon footprint for a household.
Until renewable energy becomes a reality for all, we can respond to the climate crisis by reducing our electricity consumption. This also saves lots of money, given how electricity prices have sky-rocketed, and relieves the pressure on our struggling power grid. The checklist in the booklet shows many effective ways of reducing those kiloWatt-hours.
Ten days ago, supported by EThekwini Municipality and Green Corridors, around 100 environmental education / public awareness practitioners met for an Indaba to discuss how we can accelerate our joint response to the intensifying climate crisis, and to pull together an Environmental Education & Action Network.
The organizers invited me to open the discussion by talking about “What triggered you to start acting or doing what you do?” The same question was discussed among attendees later.
So here is the mystery: Why does knowing about a deadly danger not automatically cause action, or a change in behaviour? When and why do we act (differently)?
At a recent FAO webinar on environmental education, the presenters explained how knowledge about human behaviour can contribute to pro-environmental action.
According to Self-determination theory, humans need 3 basic psychological foods: Competence: being able to do things. Autonomy: having the freedom and power to be and do. Relatedness: being connected with others.
We do things, when we feel able, when we have courage to try: “I can do this, this is not beyond me. I have the capacity. I know what to do.” Knowledge and practical know-how are also part of it. Competence.
We do things when we have the freedom to do and act. “I can choose, nobody is forcing me, I can look and judge for myself, I can evaluate and make good decisions. I can find the means to do this.” Autonomy.
We do things when we can do it together. We need to know we are not alone, that there are others doing it. We even experience FOMO, the fear of missing out. Humans love getting together, agreeing on things, doing things with others who feel the same way, or doing things that bring us closer together. Relatedness.
One can design education programmes around this.
Individual behaviour can also change when systems are set up to make it easy.
“Environmental problems are collective action problems. Targeting individual attitudes and behaviours is not enough. We need to change the systems that influence our behaviours.” (S. Hanisch)
“Nudges: positive and gentle persuasion to encourage sustainable behaviour… Nudging is based on an understanding of the psychology of decision-making… We use mental shortcuts – do what everyone else is doing or take the easiest way… we follow ingrained routines or act on auto-pilot.” (from th booklet)
UNEP has published a downloadableLittle Book of Green Nudges, that shows how this principle can be applied to encourage people to make sustainable choices. If you can offer pro-environmental, sustainable behaviour options that are easier than unsustainable ones, that are attractive, that promote togetherness or that show how you can join others who are already doing them, and if you offer these options at the right time and place, then there is a good chance sustainable behaviours will win over unsustainable ones.
E=Easy, A=Attractive, S=Social, T=Timely spells out EAST.
As EASTER Action, we would like to add ER: E=Effective and R=Responsible.
R for Responsible. Those of us who have the most and spend the most, are most responsible for the problem and therefore most responsible to act (differently). People cannot consider the environment or the climate when their families are hungry, or plan for tomorrow when today is not taken care of. “Leaving no-one behind” is a key principle of the Sustainable Development Goals.
These were mentioned as caveats, but are best included up front.
So when did I start acting on climate change and the environment? I started eradicating exotic plants when it was my little part of nature, not someone else’s (ownership? custodianship?) and when I learned to tell alien from indigenous plants. I started acting on climate change once I realized just how big and bad my personal contribution was, and when I knew what actions would make a meaningful difference.
My little patch of indigenous swamp forest. My piece of nature. Mine to cherish and to protect. (Not as in ‘mine mine‘, but more like ‘my’ family, ‘my’ children: I love them and I am responsible.)
Oh the shock, realizing that one short drive into town and back home produces 10kg CO2 emissions! … Oh the joy, being able to avoid several tons of CO2 emissions per year for electricity!
As I write, our neighbourhood is wrapped in darkness. At Stage 6 national load shedding, electricity cuts out several times a day. But we hardly notice. We enjoy the benefits of energy that shines down from the sky, for free, every day.
In August we installed a solar power system. After fretting for a while over the cost, we saved up and just did it, knowing that this investment will pay itself back in a few years. After that, electricity will be free.
Installed and pumping electricity!
Best of all, we reduced our family’s carbon footprint, making a major contribution from our side towards solving the climate change crisis.
The best location for solar panels was the garage roof, as it is the most nearly North-facing, with the least shade.
The solar panels convert sunlight into electricity. This power is variable, and it comes in as DC (direct current) while the home uses AC (alternating current). So the current has to go through an inverter.
The inverter receives electricity (from the panels, from the grid or from a battery), converts it as required, and sends it as required to the home or the battery or exports it to the grid. Beware: the inverter is noisy.
Batteries supply power at night. Without them electricity would only be available during daylight hours. They act as a storage tank, ensuring a steady supply while power production peaks and dips. The inverter also needs a battery to start up during power outages (it is a computer after all). This took me a while to understand. Without electricity from the grid or from a battery, the inverter cannot power up in the morning, and the solar panels are useless.
Inverter with complicated wiringBattery getting installed
The Watt ratings on the panels indicate the maximum power produced per square meter. I don’t know if one ever reaches that maximum, but today at lunch time (a blazing sunny spring day) our panels produced 85% of their total rating.
An online app records and makes pretty graphs of everything – the energy being harvested from the sun, our electricity usage, how much we import and export from and to the grid, even an estimate of total savings – in Rands (our monthly electricity bill) and in carbon dioxide (1.8 tons in under 3 months, or more than half a ton of coal). Wow!
Electricity production (green area) depends on the weather, the length of the day, and other factors.
At this time of year the weather is extremely variable, swinging from blazing hot sunny days to grey fog and drizzle, and back. Despite this, our solar system has supplied our needs, on average. On some days we import from the grid, on others we export. Even on the darkest days with heavy cloud cover, the panels produce at least enough electricity to keep the fridge and freezer going 24/7 (with two batteries). But this is good to know.
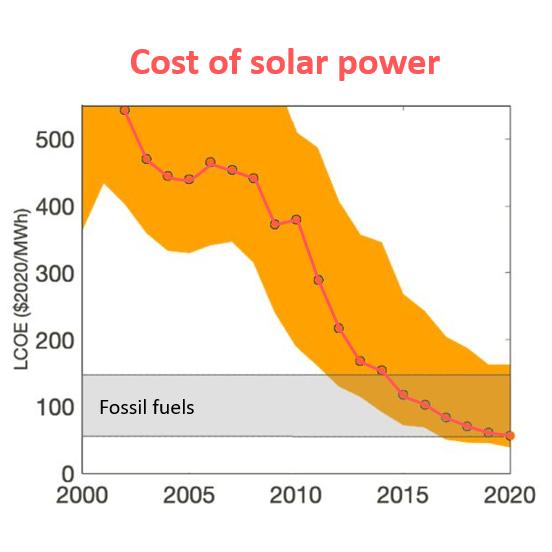
Back to question of money: these past few years the cost of solar power has come DOWN, to the point where it is now getting cheaper than electricity from fossil fuels (like coal power stations). At current electricity prices our system (which we paid for cash) would take about 10-11 years to pay off.
But electricity prices in South Africa have gone UP, faster than inflation (15% annual increase on average since 2008, which is 3x faster than inflation). If this trend continues (very likely) we will get our money back in about 7 years, after that, profit. So this is an investment that makes business sense. No wonder more and more businesses are installing solar power. In theory one can start small and add more over time.
From IPCC report 2022: WGIII Figure 6.8Based on data from Eskom
In every way solar power makes sense. It makes sense for today, it makes sense for the future, it makes sense financially, it makes sense for disaster readiness and for peace of mind.
On Youth Day (24 June 2022) the South African Youth Climate Change Coalition (SAYCCC) ran a workshop in Durban to strategize how to ramp up climate change action and activism, now that Covid-19 restrictions have been relaxed.
It was a timely opportunity for EASTERaction to hand out copies of What I Can Do About Climate Change booklet, and to present our plans for a brand new Action Programme to go with it, which we hope to roll out over the next year.
The booklet was originally written to inform eThekwini municipal councilors about personal climate action. One day before our workshop, the booklet was distributed at a climate induction workshop run by the Environmental Planning and Climate Protection Department.
Thank you SAYCCC for this opportunity and for your enthusiasm! We very much look forward collaborating on ‘the biggest challenge facing humankind ever’.
The theme of this year’s World Environment Day is “Only One Earth“. Over the past year the Intergovernmental Panel on Climate Change (IPCC, a United Nations organization) has released three key climate reports, that have one single, resounding message: We are in crisis. Or in the words of the UN Secretary General: this is “Code Red for humanity”.
As one of the IPCC support staff, I have read and re-read several drafts of these reports, as well as the Special Reports released in 2018 and 2019. “Every year matters!” the first one said. But a year ticked by. And another. And another. And another. The crisis is upon us, and still we are dilly dallying, carrying on as before. It scares me how much is known, and how little is being done. It is surreal.
This year Durban got flooded – one of the worst floods on record. But… we mopped up the mess, made (or started to make) repairs, and carried on. Six weeks later it happened again! Disasters like this will keep getting worse and happen more often.
Today, on World Environment Day, EASTER Action would like to thank and congratulate the hundreds of scientists who contributed towards the IPCC reports, who spent so much of their time and energy, often under extremely difficult situations, to bring together, assess and summarize the latest, up-to-date information on climate change, and to map out the options. Thank you, thank you, all you dear people! And well done! Thanks to you we know what to do next.
May the world listen to your warning, and do what needs to be done, to save this one and only earth, our home, and all its children.
We highly recommend these brief 2-3min trailers. They are beautifully made and give a fantastic overview of the current state of climate science.
The latest reports (2021/2022):
The Physical Science Basis
Impacts, Adaptation and Vulnerability
Mitigation of Climate Change
The Special Reports (2018/2019):
Special Report on Global Warming of 1.5°C
Special Report on the Oceans and Cryosphere
Special Report on Land
About the IPCC and the current assessment cycle.
See the IPCC channel for more videos on the various press conferences etc.


