We recently completed another round of workshops with Grade 10 learners, following the first round in March, in partnership with Umkhumbane Schools Project in Cato Manor, Durban. Two WESSA youth educators joined us this time, hopefully we’ll work together in future.
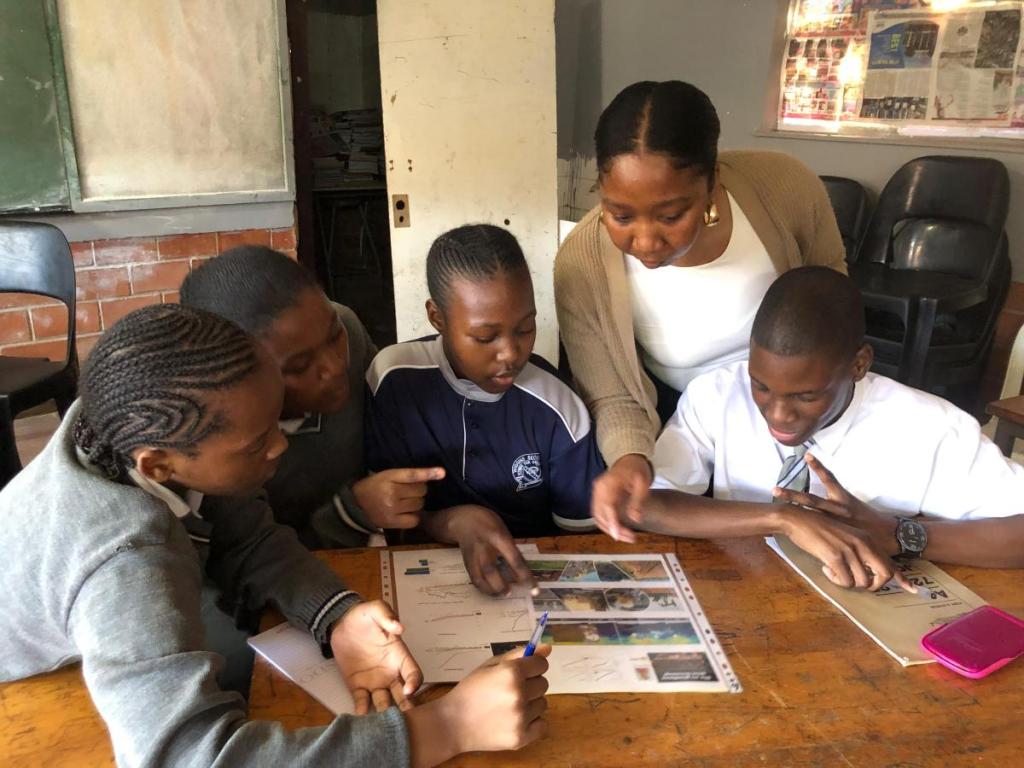
Since the last workshop series in March was a while ago, we started with a refresher exercise. Instead of me (the facilitator) doing the talking, we split up the learners into small groups, and gave each group a print-out of one of the videos we watched previously, to refresh their memories.
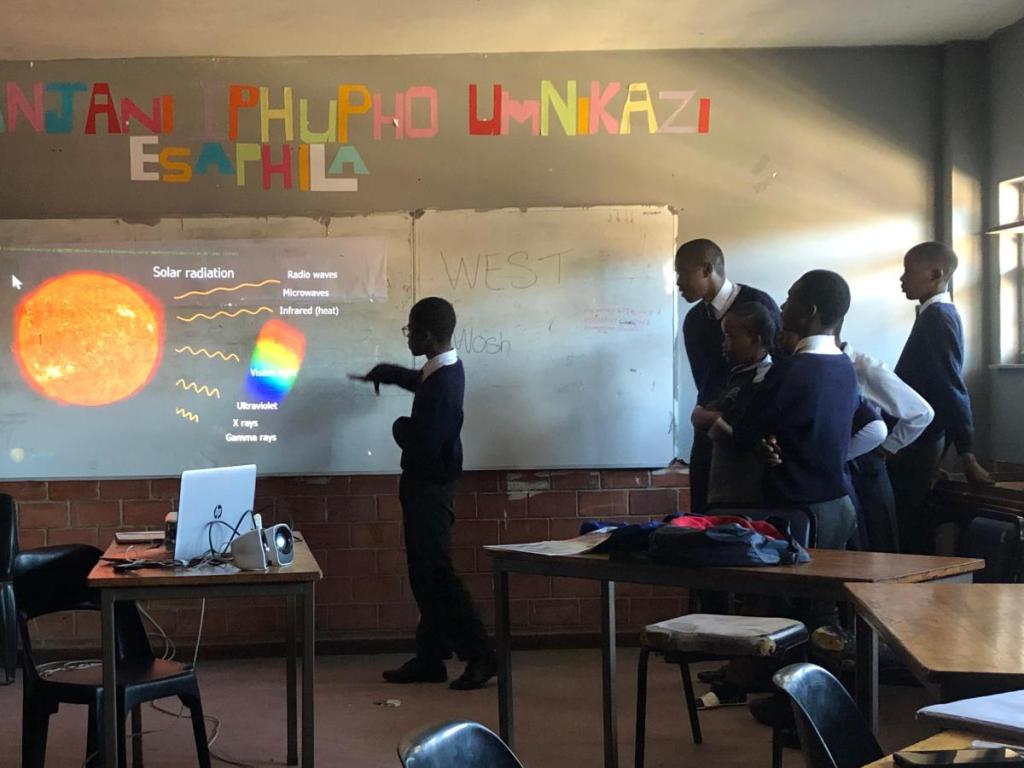
The learners then presented the slides to the larger group and gave brief summaries of anything they had remembered. I reminded them that this was not school and that there was no evaluation, that they should not feel pressured or stressed, but just quickly walk us all through some of the highlights. This was a fun and highly entertaining, the learners were very enthusiastic.
Learners refreshing their memories
Learners presenting a summary from the last workshop
Unit 7 “What does climate change look like”?
The video for this unit shows the many faces of climate change – changes in the weather, changes on land and in the oceans, changes in the frozen parts of the world, sea level rise. We all felt a bit depressed at the end. But everyone agreed when I said, “These things are happening anyway, whether we are aware of it or not. Myself, I prefer not to be ignorant of what is going on. I would rather know, because then I maybe do something about it, and also then I can adapt my life and not get caught by surprise.”
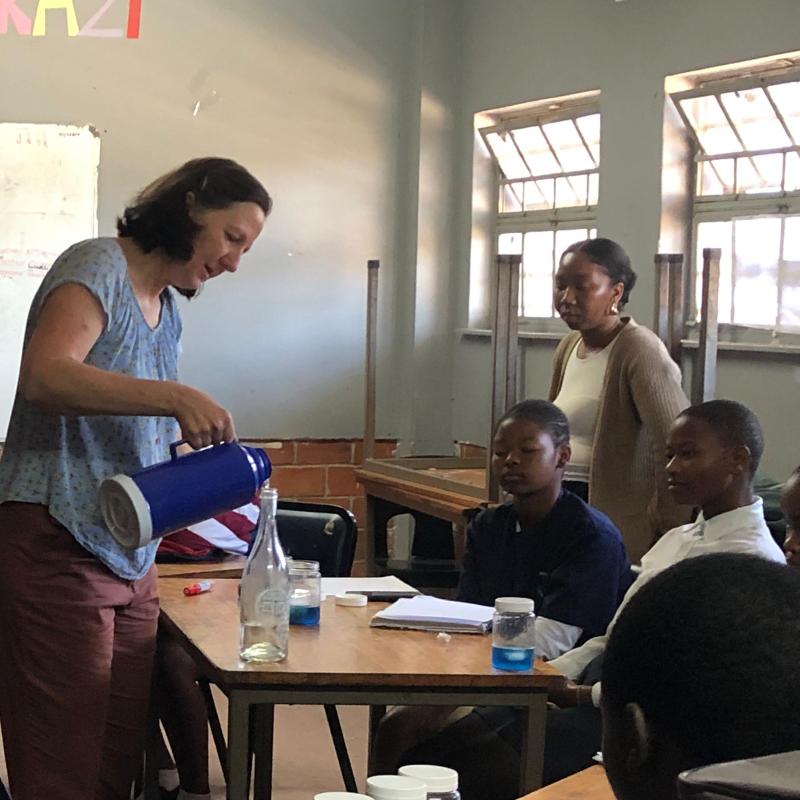
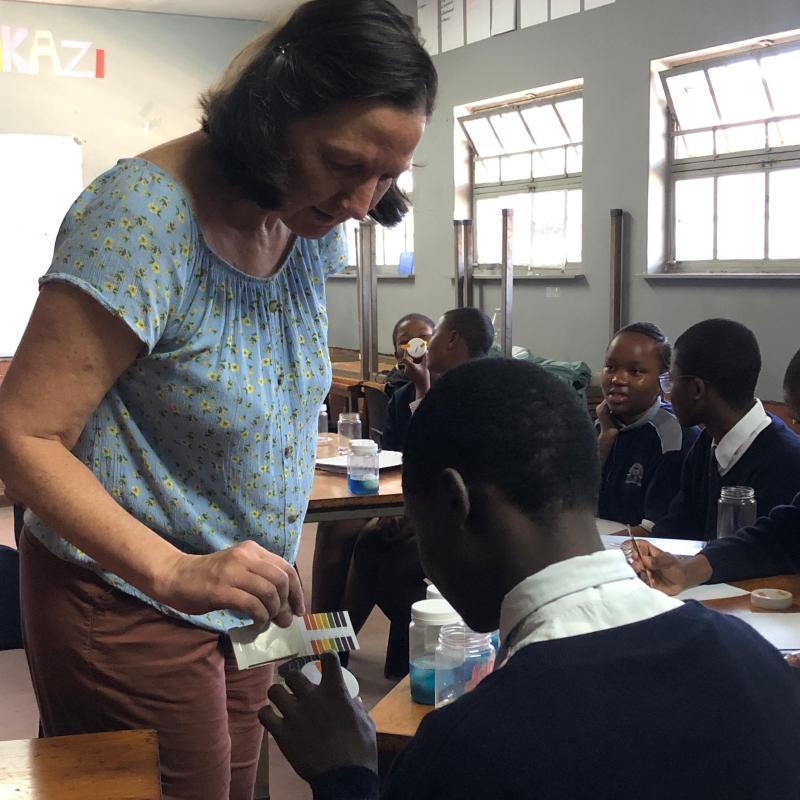
We then carried out two simple experiments about sea level rise caused by melting glaciers and warming oceans, and one about ocean acidification and the effect on calcium carbonate solubility.
Do melting sea ice and land ice both cause a rise in sea level? Marking the ‘sea level’.
Demonstrating that hot water takes up more space than cold water.
Do sea shells dissolve in acidic water? Checking the pH.
Unit 8 “Why should I care? How does climate change affect me?”
On the first day the learners went home with a questionnaire, to interview an older person in their household. They asked about any changes or disasters they had experienced during their lifetime.
On the second day, learners interviewed each other, in a mock TV show, talking about their family’s – or their own – experiences and opinions. “Who has family or friends who may not have heard about climate change? What could you say to them? How would you explain climate change to your granny?” I was blown away with the confidence and enthusiasm with which the learners threw themselves into this activity.
The results speak for themselves. Enjoy!
The Unit 8 video covers the many ways that climate change affects us as humans – our food systems, health and wellbeing, the economy – and how it can cause poverty, displacement and conflict. It explains how we depend on nature and how climate change threatens our entire society, often in complex ways.
While watching the video, learners listened out for facts that might answer the question: “Why did the Nobel Prize for Peace get awarded to people who spread knowledge about climate change? How could climate change disturb the peace, between individuals, communities or countries?”
Learners paired up to discuss this question, we collected ideas from the floor and discussed them in the big group. Responses included: communities or countries fight over scarce resources, such as food, wood or water; people fight with their governments over policies or unfair food allocations; activists fight with law enforcement; ‘false activists’ turn environmental causes into terrorism. Another two short videos, by international peace organizations, rounded off this section.
The learners’ responses were very insightful and thought-provoking.
Unit 11 “What can I do about climate change?”
Finally we get to the most important part: action. The interactive video highlights the top priorities, based on where the most greenhouse gases come from, and where action would therefore have the greatest ‘bang for buck’. It also talks about climate justice, an important topic for young people living in underprivileged conditions.
Unit 13 “Electricity”
The third day was devoted to the top action area: energy – more specifically, electricity. We started with a game called ‘Circuit Breaker’, where we passed ‘electrons’ from a ‘battery’ around a ‘circuit’. One person was the ‘switch’, another the ‘radio’, another a ‘resistor’. When things got out of hand, and ‘sparks’ started to fly, the ‘circuit breaker’ tripped, and the game had to be ‘reset’.
How fast can you make the ‘current’ flow?
Then we talked about electricity in the home: the distribution board, the electricity meter, different ways of purchasing electricity.
It’s easy to save electricity in the home, just by doing things slightly differently. Thereby we can reduce our energy carbon footprint as well as our monthly electricity bill. So how much power does it take to boil a cup of water – in a kettle? On a stove? In a microwave? We timed boiling water with different appliances, and converted the answers to kWh, grams of greenhouse gas emissions, and into Rands and cents. Then we cooked a pot of rice by wrapping it in a blanket.
Boiling water in a kettle used the least power.
A pot of rice, once boiled, can cook in a hotbox without further power.
On a personal note: I (Marlies) would like to thank Martha Bishai and her team at the Umkhumbane Schools Project – especially Precious, Nokwanda – from the bottom of my heart for their support and partnership. Years ago Martha invited me to engage their biodiversity group. Since then Martha’s encouragement and participation inspired me to keep going forward, and to dare think bigger and aim higher. I am deeply grateful for believing in this work and investing in EASTER Action!
The details may be complicated, but the conclusion is not: PV works.
The biggest hurdle for many remains the cost – despite tax breaks and the lowest-ever prices. Before ‘splashing out’, they want to know: Does solar power really work? Money-wise and otherwise?
Next month is World Energy Day (22 October). I hope this blog will help some who are still unsure about PV, make a positive decision.
Design
Various suppliers and websites can help you design a system that matches your lifestyle, your needs and your budget.
We were lucky to have an expert friend, an electrical engineer who was involved in the design and construction of the de Aar solar farm. He gave us an initial design, along with all the numbers. His calculations included many engineering details, such as hourly data on solar irradiance (how much energy shines from the sky), based on the local latitude and altitude, and how much is collected by the panels, based on temperature, windspeed, albedo, and the angle and orientation of our own roof. After accounting for various losses, you get an estimate of the actual DC voltage generated by the panels, and the final AC power you can expect to get out of the system.
We had saved up for solar power, and were willing to spend a bit extra to get the most out of it.
Panels: We installed our panels on the garage roof, as it was most north-facing, with the least shade. The panels are the cheapest part of the system, so we decided to install as many as would fit on the roof (17 panels).
Batteries: We did not consider a solar system without batteries. Apart from reducing our carbon footprint, power storage was the main attraction. Despite the price tag, we decided to get two 5kW batteries. We felt that the extra investment would pay itself off in avoided grid usage, and would help during loadshedding and longer outages.
This has definitely worked in our favour. Two batteries, once fully charged, supply our needs through supper time until well past midnight, often until dawn – depending on how much power we use in the evening. During the day the batteries help supply the geyser and other power-intensive activities, especially on cloudy days.
Inverter: we decided to spend a few thousand Rands extra on a large 8kW inverter, instead of the standard 5kW inverter recommended for households of our size. We reasoned that with 17 panels, peak power generation would be well above 5kW on a sunny day, and we wanted to harvest this power.
Was the 8kW inverter worth it? In retrospect, no. On a sunny summer day, power production reaches 8kW for many hours. This is far more than we can utilize, and most of it gets exported to the grid (i.e. ‘wasted’ from our perspective, as we don’t get paid for this). The 5kW inverter would simply have capped generation at 5kW.
Power production in mid-winter anyway peaks at just above 5kW, and on a sunny winter day we still have too much, exporting around 30% of the power generated. On overcast days the system never reaches the 5kW limit. So… a 5kW inverter would have sufficed. If the municipality paid us for the electricity we export, it would be a different story. Lesson learned.
This blog by the editor of TechCentral, has other useful details on the design side. A ‘solar for dummies‘ article by one of the solar company is also helpful. (We went with another company and were very happy with their service.)
The system flow chart as displayed on the inverter screen.
Wiring
If you install PV power, while remaining connected to the grid, the distribution board has to be split into ‘essentials’ (powered by PV during grid outages) and ‘non-essentials’ (not powered by PV during grid outages). The main decision is what is ‘essential’ and not.
We were advised to wire the geyser, stove/oven and pool pump to the ‘non-essential’ section. That is because together they can draw more than 8kW – the limit of what our PV system can supply. Over-loading the inverter would cause the system to trip.
We also decided to put the granny flat on the ‘non-essential’ circuit, because we cannot control what tenants do during loadshedding, and this might cause unnecessary conflict.
What does this mean in practice?
When the grid is available, everything is connected and can be powered by the PV system, even the ‘non-essential’ circuits. If ever the total load exceeds the 8kW limit of our PV system, the grid supplies the excess.
However during grid outages, the ‘non-essentials’ are not powered: the pool pump doesn’t run, the geyser doesn’t heat and the stove doesn’t work (even when there is plenty solar power).
Ok, so the geyser simply catches up when the grid comes back online, drawing on the PV system as before, and we don’t notice loadshedding in that regard. However I found it annoying to have no stove during loadshedding, when I could be running it on solar power.
So we got an electrician to install a special switch, allowing us to connect the stove/oven to the ‘essential’ part of the DB temporarily. We just have to be aware, and not use too many appliances at the same time, and then switch the stove back to the ‘non-essentials’ afterwards. This was a brilliant idea.
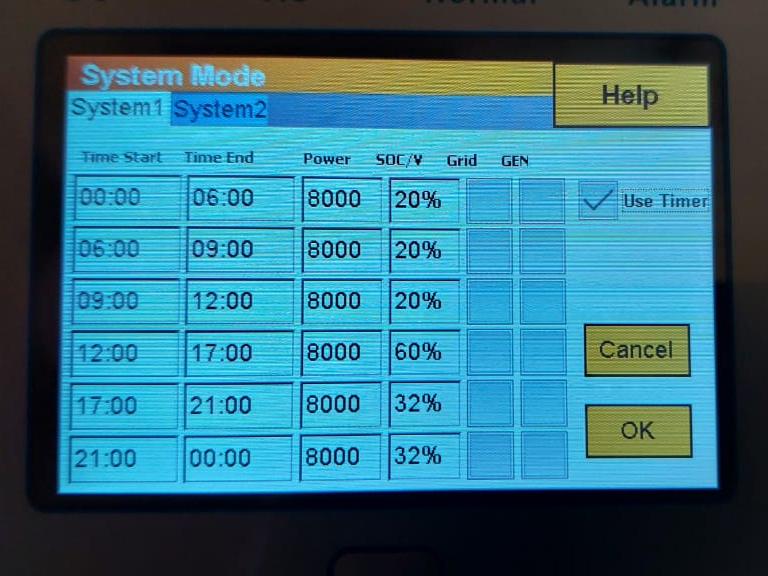
Settings on inverter
Another decision point is how to program the inverter. Like, whether to export or not, whether to charge the batteries from the grid, and especially, how and when to use the batteries.
You don’t want to run the batteries flat, as this reduces their lifespan. In fact, it is advised not to run batteries much below 20% charge. So one should program the inverter to switch off the batteries when they reach 20%.
We also made the decision never to charge our batteries from the grid, only from solar power. Converting grid power to battery and back just wastes energy. We can always get by until sunrise.
During periods of loadshedding, our inverter is set to run batteries down to 20% after midnight and during the morning. But between 12h00 and 17h00 the system will not let the charge drop below 60%, to ensure there is enough charge left for the evening. If by 12h00 the batteries have not to 60%, it’s a bad solar day. On such overcast days we would rather use the grid in the afternoon, and keep the batteries for later, in the case of loadshedding. After 17h00 the batteries may drain to 32% until midnight, and to 20% after that.
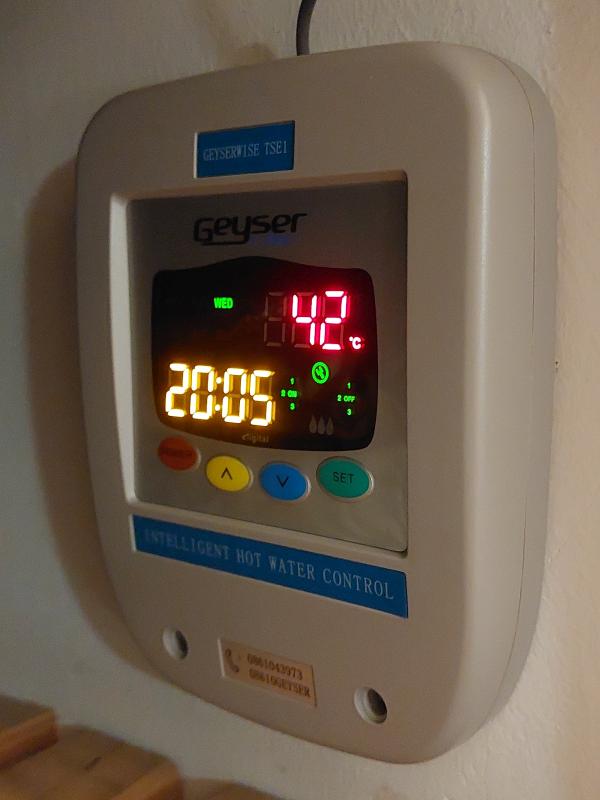
Geyser controller
The geyser draws a huge amount of power, and we avoid using the grid for this, if possible. A digital geyser controller turns on the geyser during peak daylight hours. Keeping it heated all the time would be a complete waste.
Our geyser is set to come on at 10h30 heating to 55°C; and again at 12h00 heating to 65°C. This is enough for up to four hot showers in the evening. Spreading the heating over two periods gives the batteries a chance to charge as well, especially on partly cloudy days.
In the early morning hours the geyser comes on briefly to top up the temperature to 45°C, for one hot morning shower. Usually the water is still warm from the previous day and it heat for 10 minutes or less.
On weekends the settings are slightly different. We keep tweaking the timings to minimize our grid usage.
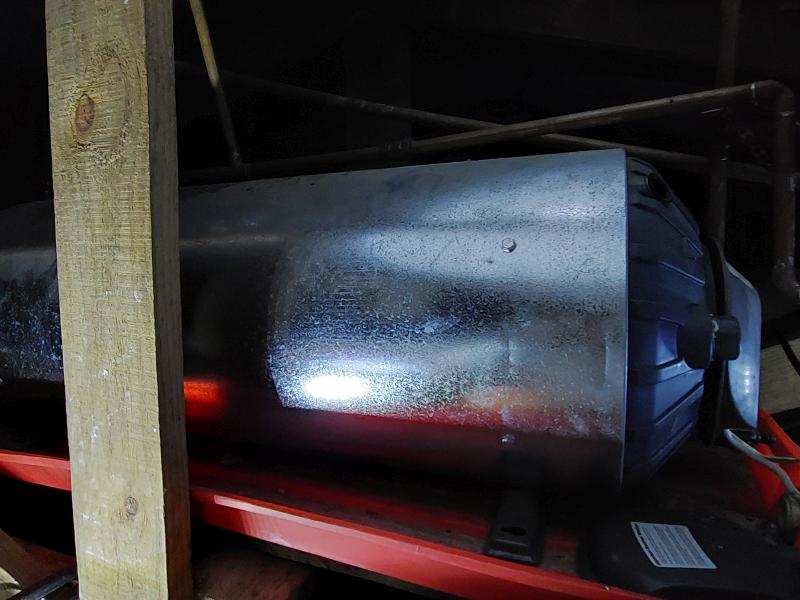
We also finally installed a geyser blanket, which cost all of R300, to reduce heat loss in winter.
Bare geyserGeyser blanket installedGeyser controller
Behaviour
Installing solar power was only the first step. Then we had to learn how to use it.
In the beginning we got on average 60% of our electricity from the solar system. Now we are getting over 80%, from the same system.
We have learned a LOT. From the graphs generated by the PV app we have become very aware how much electricity different activities and appliances require, how much power is generated in different seasons and weather conditions, and we have learned how best to utilize it.
We have shifted energy-intensive activities to daylight hours: washing machine, dishwasher, or when necessary, the tumble drier. We also use many of the electricity saving methods described on the climate change booklet checklist. It just becomes a way of life.
The pool pump draws a lot of electricity (yes we have a pool, eish!) We use a simple manual timer, set to the brightest times of the day: in summer it runs from 8am to 4pm, in winter from 10am to 2pm, which is enough to keep the pool clean. On overcast, bad solar days we turn the pool pump off.
Power generation and use
Through the seasons, days get shorter or longer, more sunny or more cloudy. Our best solar month so far was January 2023 (1124kWh generated), the worst was May 2023 (480kWh) – which had lots of cloudy weather and short days.
August-December 2022
January-June 2024
Comparing monthly graphs from 2022 with 2024, the amount of solar power generated (‘PV’ – green bars) remained around 800kWh per month, regardless of time of year. Our home electricity usage (‘Load’ – pink bars) was also fairly constant, between 600 and 700kWh per month.
However the amount of electricity exported to the grid (light orange bars), was a lot more in the beginning (400kWh), down to 240kWh per month now (meaning we now throw away less of the power that we generate).
The amount imported from the grid every month (dark orange bars), which we had to pay for at the usual rate, decreased from 280kWh to 120kWh per month, more than halving our remaining electricity bill.
In other words, in 2022 our solar system supplied 58% of our electricity usage, in 2024 it supplies over 80% on average.
How? Partly by making the various adjustments described above. But mainly by using our batteries throughout the day. In the beginning we only drew on the batteries at night (or during loadshedding), not otherwise. Now we use them whenever demand (load) exceeds PV generation.
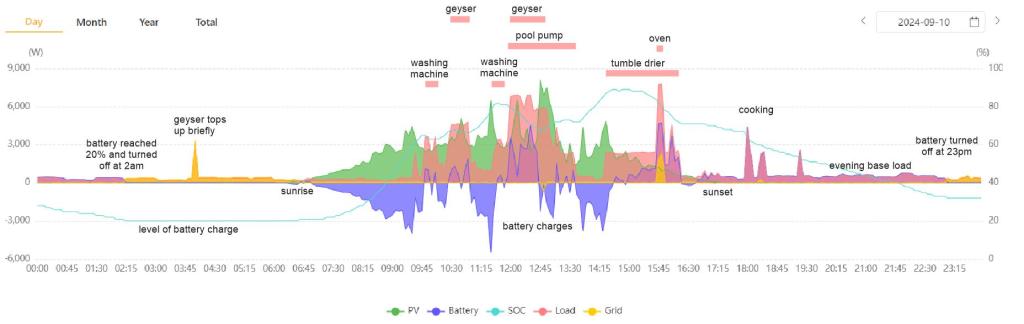
On this partly cloudy, busy day, the solar system nevertheless supplied most of our needs, which included two loads of washing, geyser, tumble drier, dishwasher, a few hours of pool pump, baking and cooking. The battery is alternatively charging and discharging throughout the day, never reaching 100%. It ran out before midnight. No power was exported to the grid on this day.
Despite the partly cloudy weather, 90% of our electricity usage on this day was supplied by PV (Import/Load), only 10% was imported from the grid.
Economics
Does solar power make financial sense? Yes.
In 2022, our electricity bill would have been on average R1600 per month, based on our usage. That first year we paid only R670 (imported from grid), thus saving R930 a month (58% savings).
In 2024 electricity would have cost us R1880, but we paid R350, saving R1530 a month (81% savings).
In total so far we have saved about R30 000. We could have saved more based on what we know now.
Our system cost around R210 000 to install in 2022. If we assume inflation remains at 6.4% (the average over the past 2 years), and that electricity prices increase at the same rate, the savings would pay off that amount in 10 years. However for the past 8 years electricity prices have increased by 12% every year, double the inflation rate! If this trend continues, total savings would reach R210 000 in just over 5 years (not considering the interest earned).
As mentioned, we had saved up for it, and paid in cash. Had we put the expense on our bond, the savings would pay off the expense plus interest, after about 12 years, without putting in a cent extra.
Embedded rooftop solar PV
When you install rooftop solar, you have to register – here are the guidelines.
In our experience, until our system was registered, the municipality continued to bill us at our pre-PV consumption levels, despite repeated confirmed meter readings.
Once our registration went through, the municipality came and installed a bi-directional meter. Our excess payments were then credited back to us (not paid out in cash), against our monthly bills.
Do you get paid for power you export to the grid?
Yes and no. eThekwini municipality allows embedded power, at least in principle. But in our case it makes no financial sense. Here’s why:
Currently, we pay R 2.97 per kWh, with service charges built in, same as everyone else. If we wanted to earn money on our exports, we would have to sign up for the Feed-in Energy scheme. However, the price structure is not in our favour.
According to the 2023/24 tariff booklet, we would earn R1.44 per kWh (similar to what the city pays Eskom), but we would have to pay an ‘Ancilliary Network Charge’ of R126.86 per kVA (based on the inverter size). On our 8kW inverter that would amount to R1015 a month. 1015/1.44=705.
In other words, we would only start earning on exports above 705 kWh, which is more than we export currently. So for us the feed-in system makes no sense financially – we would spend more than we would earn.
So we simply donate surplus electricity to the city (rather than dumping it) – say ‘thanks’, eThekwini! Subsidizing the city is ok for now, but if too many people pour their excess power into the grid, eventually it runs in reverse, and you get negative electricity prices, which is becoming a conundrum in other parts of the world. (I’m sure there is a solution for having ‘too much’ free energy! The market will respond, don’t worry.)
Back to our local situation: with a 5kW inverter, one would start earning on exports above 440kWh, but then we would probably export less, as the smaller inverter would simply cap production at 5kW.
Variable daily rates – with highest prices during peak demand, and lowest prices during low-demand and high-supply periods, can be a powerful incentive for users to shift their consumption. A system like this is in place already (‘Time of use’ fee structure), but the minimum charge of R234.24 again means this only makes sense for high end users and businesses. A variable fee structure would not be fair for low-end users who tend to have less freedom of choice and less flexibility.
This workshop offers training and resources on climate change, to empower educators to engage learners (and their families), to build climate change knowledge and know-how and stimulate action.
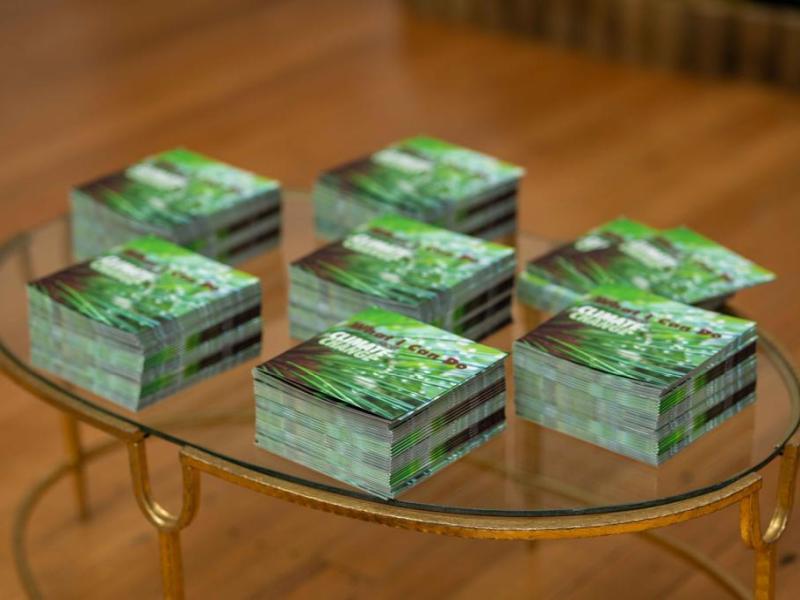
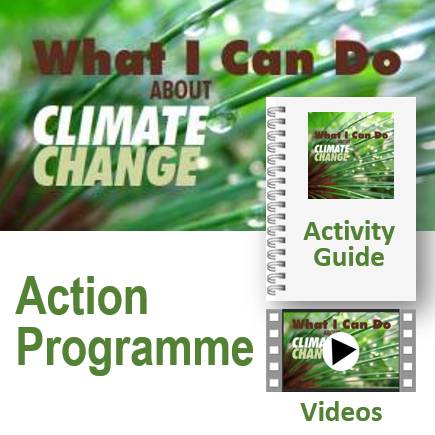
Participants who would like to engage their learners using the resources provided, receive up to 200 climate change booklets for distribution to learners (while stocks last – so don’t miss this unique opportunity). Participants also receive an activity guide and access to online video material.
WHO IS IT FOR? Teachers or other educators of high school-age learners and upwards
The booklet ‘What I Can Do About Climate Change’ was produced by the Durban Office of the Intergovernmental Panel on Climate Change (IPCC) Working Group II Technical Support Unit* (free download). The booklet was prepared to increase the accessibility of IPCC science to help inform personal climate action in Durban.
The What I Can Do (WICD) Action Programme* was developed by the lead author of the booklet (Marlies Craig) to increase active engagement with the booklet. It contains brief lessons (videos), and guidelines for hands-on activities that are suitable for different ages and school subjects. Some are immediately relevant to different parts of the school curriculum. The programme is designed for schools, nature and conservation clubs or educational organizations, adding interest and giving ideas for things to do – in the classroom, on campus, ‘out there’ and at home.
This workshop presents four key units of the WICD Action Programme. In the following months, participants engage their learners (and families, achieving a ‘multiplier effect’) and provide feedback on activities and results. In other words, this is not a workshop that ends when everyone goes home. At a later stage, we hope to host a follow-up Climate Action Expo, where participants can showcase their projects and activities.
*Not an official product of the IPCC. Neither the booklet, nor the programme or training, are reviewed or endorsed by the IPCC.
Today, on World ConsumerRights Day, I make a wish to be able to afford an electric car. I would like manufacturers to stop reserving this innovation for the luxury niche, and produce models for the mass market. It looks like my wish may start coming true soon.
Last week I met a person who was adamant that electric vehicles (EV) are no better than ordinary cars (with combustion engines). I felt so helpless against their firm belief in this misinformation, and decided a quick blog on this was in order.
There is plenty of evidence that EVs are a huge improvement, from the the US EPA debunking ‘EV myths‘, to the detailed scientific account of the IPCC Working Group III chapter on Transportation. EVs win hands down – especially when charged using renewable energy (such as solar power or wind).
An ICCT report shows life-cycle emissions from different kinds of mid-sized cars registered in Europe. The graphs for other countries look very much the same.
Full life-cycle analysis takes account of greenhouse gas emissions of a product, during all stages of its existence: manufacture, storage, transport, retail, operation while in use, and finally scrapping or recycling – including powering and supplying all the raw materials and processes along the way.
Battery technology is also progressing rapidly – watch this space. The perceived issues with Lithium-Ion batteries will soon be moot. The more we invest in EVs, the more research and development will happen, and the sooner we’ll see even better solutions.
Having said all that, I must now confess that owning and driving a car is an environmentally unfriendly privilege for those who can afford it, that should eventually be phased out. Manufacture-related emissions are still considerable, and electric private cars are not the solution for a climate-resilient future. To achieve net-zero-emissions, electrified public transport is the way to go – of course fueled by renewable energy.
However, EVs have another potential use: vehicle-to-grid technology is an emerging solution to help solve the problem of variable power supply from solar and wind, providing power stability to the owner or even to the wider grid. EVs are plugged into the grid whenever they are not in use, adding to the total power storage capacity. They store excess power when available, and help supply the grid during high demand periods.
UPDATE (22 April 2022): in a recent article “The search for South Africa’s lost electric car“, the Daily Maverick reveals that already back in October 2008 an electric vehicle (the Joule) was unveiled at the Paris Motor Show. Full-scale production was supposed to start in 2012, “with cars in showrooms by mid-2013”. ‘Van Van’ replied that they saw the Joule displayed at Cop17 in Durban: “It was beautiful.” Jeffrey Barbee shared a link to a video:
This is so amazing! But for some reason the Industrial Development Corporation of SA pulled out, the government refused to provide funding, the idea was scrapped. Apparently one out of the four fully functional cars still survives. Now I feel deeply depressed that 11 years ago South Africa missed such an incredible opportunity.
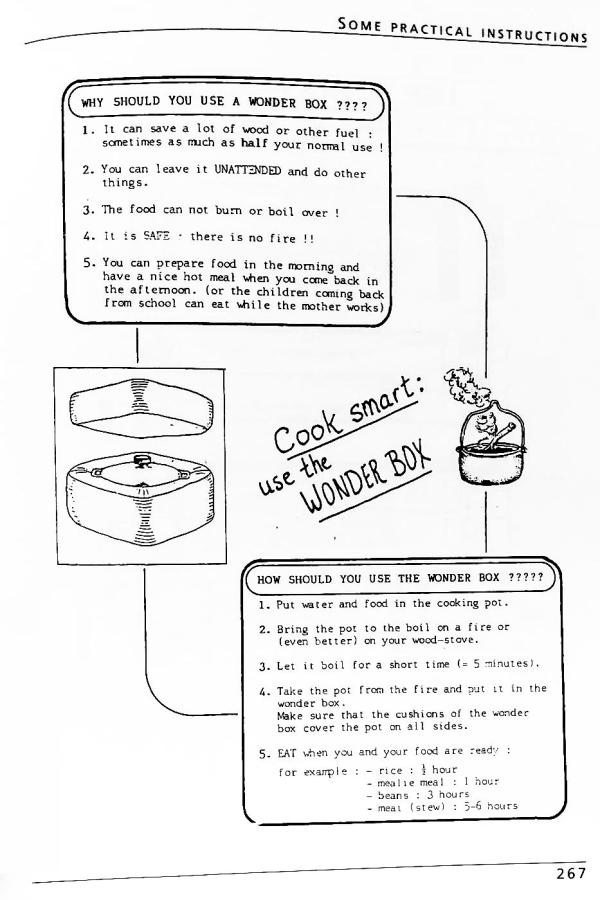
Cooking in a hot box / hot bag saves electricity while reducing our carbon footprint. Food takes only slightly longer to cook than on the stove, and can be left unattended (it doesn’t burn or boil over, and doesn’t need to be stirred).
I even find that stews and soups cooked like this tastes better and more fragrant. Rice is more fluffy and evenly cooked.
A hot bag can also be used to keep things cool – more efficiently than a cooler box.
This is the kind of hot box / wonderbag / hay box that one can buy, promoted here by the Department of Economic Development, Tourism and Environmental Affairs.
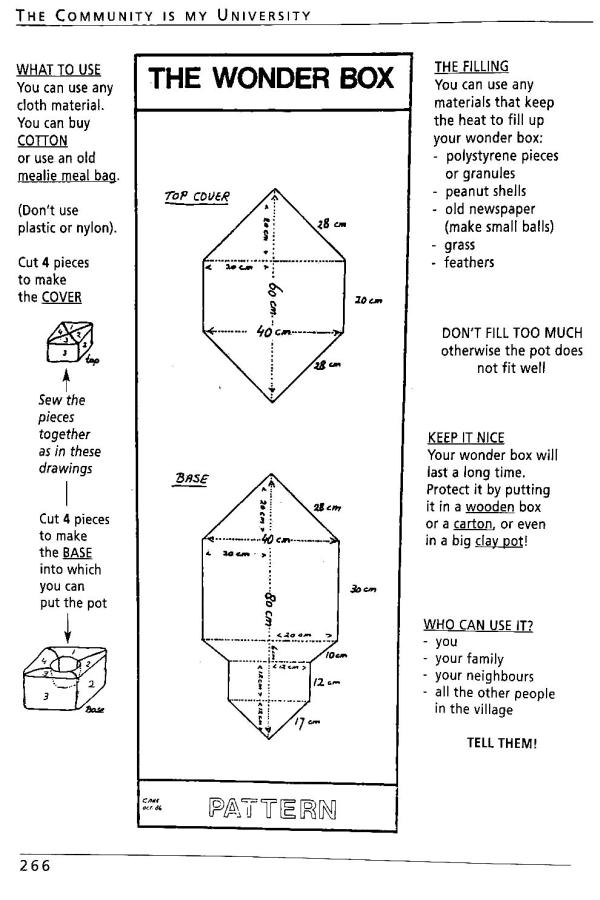
This beautiful book on community development and rural health, has instructions for rural women on how to make a ‘wonder box’ out of old cloth such as old linen mealie meal bags and stuffed with insulating peanut shells, grass, feathers or old newspaper.
You don’t need a box at all though. Some warm blankets work just as well. Hikers know this trick: you only need one little gas cooker for a 3-course meal. Boil a pot of rice, wrap it in your sleeping bag, then prepare your soya mince sauce (which cooks much better, without burning, in another sleeping bag), while you cook the dried vegetables (or make a nice cup of Milo).
Hiking and camping at Mont-Aux-Sources in the Drakensberg.
At sea level, water boils at 100°C. For every 300m rise in altitude, the boiling point of water is about 1°C lower. So at the top of Amphitheatre, at 3200m, water boils at 89°C. At high altitude food simply takes longer to cook – just something to keep in mind.
For my kitchen I recycled an old kiddies’ duvet that had gotten lumpy. I use this regularly to cook rice, stews, soups – anything that otherwise needs prolonged simmering on the stove. It really helps during loadshedding: as long as I get the pot boiled before the power goes off, no problem.
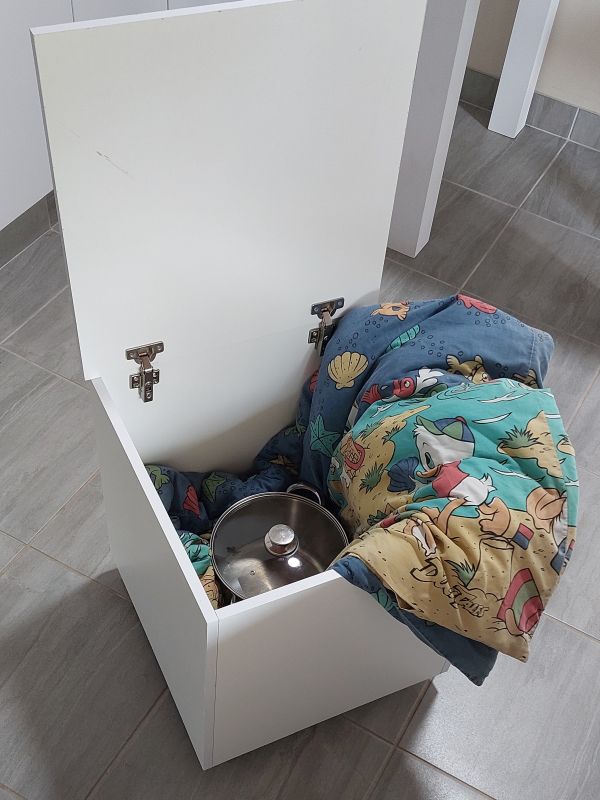
I got this fancy solid box made, on wheels, with a lid. It goes under the table, serves as a seat, and when needed, it comes out and becomes an oven.
How much electricity (and carbon dioxide emissions) does a hotbox avoid?
That depends on the kind of stove we are comparing it against, and the kind of food we are cooking. Since one needs to bring the food to the boil either way, the hotbox only saves on the simmering time. Food that only takes 15 min to cook on a stove would save only a little electricity; food that has to cook for hours, saves a lot. So the cooking box is particularly useful for meals that require longer cooking times.
1kWh electricity produces approximately 1kg of carbon dioxide emissions.
For those who like actual numbers, Eskom reports that it produced 198 281GWh of electricity in 2022, with 207.2Mt carbon dioxide emissions (plus 32.90Mt ash and 66.65kt particulate matter). Converted that is 198,281 million kWh and 207,200 million kg. Divide kg by kWh to get emissions per energy used.
A typical 1000W stove plate, if set to maximum heat, would use 1kWh per hour, and produce 1kg of carbon dioxide in emissions. So let’s say you simmer food (on level 3 out of 6) then you can assume a typical 1000W plate will consume approximately 0.5kWh per hour on half heat, which equates to about 0.5kg carbon dioxide. Now do that every day. Perhaps you use more than one stove plate at a time. All that adds up very quickly.
Please have a look at the total kWh on your last monthly electricity bill, and multiply that number by 12 to get the number of kg of carbon dioxide your household adds to the atmosphere every year. Now think: you can do something about that. Just dig out an old blanket and start today!
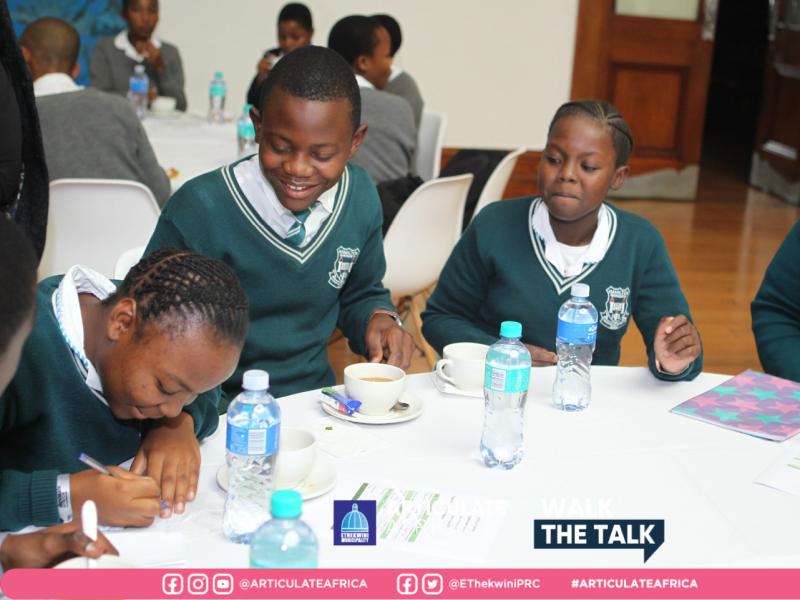
On 19 May I presented at a Climate Change Seminar, under the slogan ‘Walk the talk’. It was part of a three-day-long Articulate Africa Art and Book Fair, hosted by eThekwini Municipality’s Parks, Recreation and Culture Unit. The seminar was attended by around 60 learners from 6 schools, along with around 40 teachers and local stakeholders.
The learners proved that they already know a lot about climate change. They got top scores for quiz questions about what the greenhouse effect is about, about the causes and effects of climate change, and whether scientists agreed on what was going on. Impressive!
BUT, as we reflected before, knowledge does not automatically lead to action. Despite two centuries of climate science, and decades of international negotiations and agreements, government policies are still taking us to 3°C global warming or more. Yet the dangers even of current levels of warming (1.1°C) are clear, just read the news.
The climate crisis is much too serious to wait for governments to act, or to tell us what to do. Instead we, civil society, need to act of our own choice, and put pressure on government and industry to do the right thing. Democratic governments may not listen much to the science, but they do have to listen to the people. So let us ‘walk the talk’.
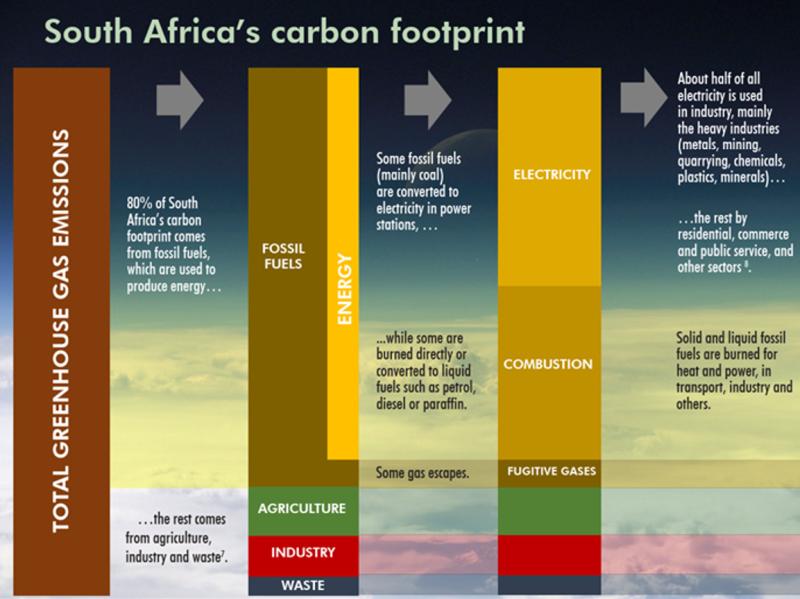
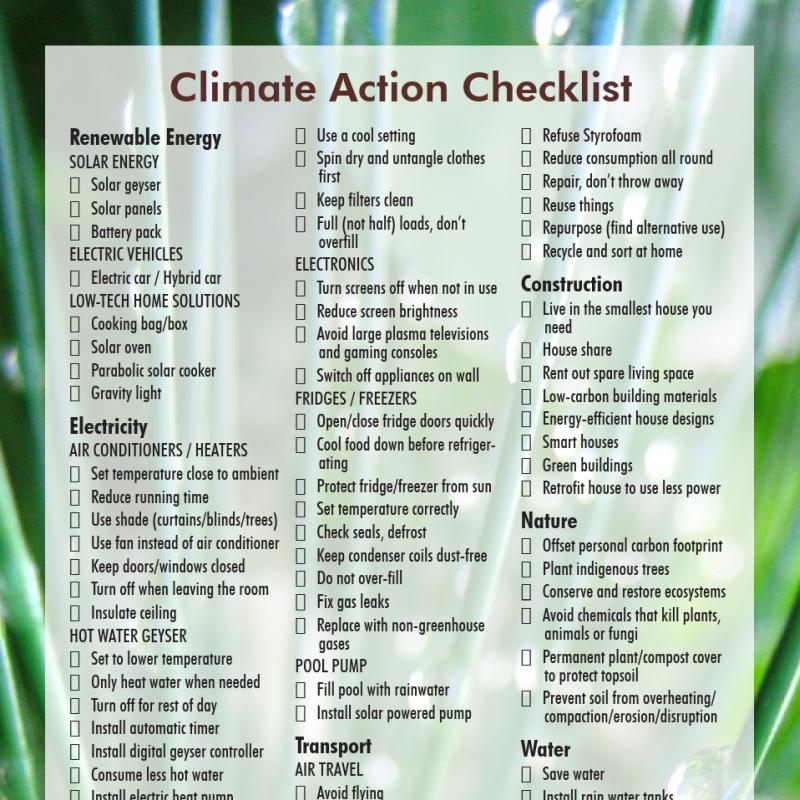
South Africa is the country with the 15th largest carbon footprint in the world. Climate change is not just someone else’s problem, but also ours. Page 6-7 in the booklet illustrates where all our country’s greenhouse gasses come from: 80% come from fossil fuels, about half of which goes to producing electricity from coal. To make a meaningful dent in our national carbon footprint, we need to reduce electricity consumption.
The residential electricity-related emissions can be very high, especially for appliances that are left running for many hours, such as air conditioners, heaters or geysers, and for those that involve heating.
The bar graph (on page 13 in the booklet) shows that electricity use in the home can generate many tons of carbon dioxide per year. How much is a ton?
In an interactive session, the learners at the seminar found out how to read and interpret a municipal electricity bill, and to calculate the electricity-related carbon footprint for a household.
Until renewable energy becomes a reality for all, we can respond to the climate crisis by reducing our electricity consumption. This also saves lots of money, given how electricity prices have sky-rocketed, and relieves the pressure on our struggling power grid. The checklist in the booklet shows many effective ways of reducing those kiloWatt-hours.
The Internet is full of fantastic ideas for upcycling generally (turning waste into something useful), and rag-rugs specifically. Old T-shirts too stained to pass on as second-hand clothing, still find a use. Stretchy fabric works best. Ideally the fabric should not fray.
Rags to strips
Start by cutting off any seams. Then cut the fabric into strips, in a zig-zag pattern to make one long continuous ribbon. You don’t need to cut straight either, curves is fine.
Remove seamsCut fabric in a zig-zag
On fabrics that stretch in one direction only, it is better cutting in the direction of the stretch rather than across it.
The strips can be from 1 to 3cm wide. The thinner the fabric, the wider the strips.
The thicker the yarn, the thicker the final carpet will turn out.
Find a route that has the smallest off-cuts, for instance:
top
sleeve
pants
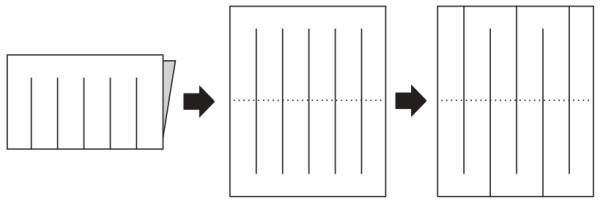
To save time, fold the fabric in half. Cut from the fold to within 1cm of the edge. Open up the fabric, and snip through to the edge, on alternating rows, to create a continuous strip, like this:
A lovely selection of matching colours.
Strips to yarn
To connect individual strips quickly and easily, loop them through each other. Cut slots into the ends; first push the end of strip A through the slot in B, then pull strip B through the slot in A:
Once I got a huge bag of off-cuts from a T-shirt factory. It took ages to untangle all that cotton Lycra – much longer than it took to crochet the rugs afterwards.
Yarn to rug
If you don’t know how to crochet, check out Sarah‘s blog for example. The simplest crochet pattern starts with a chain, and then works back and forth until the rug is long enough.
The last time I crocheted anything was at age 5.
Here is an alternative pattern for a rectangular rug. Hopefully the instructions make sense. (I am a complete novice and cannot read or write a proper crochet recipe.)
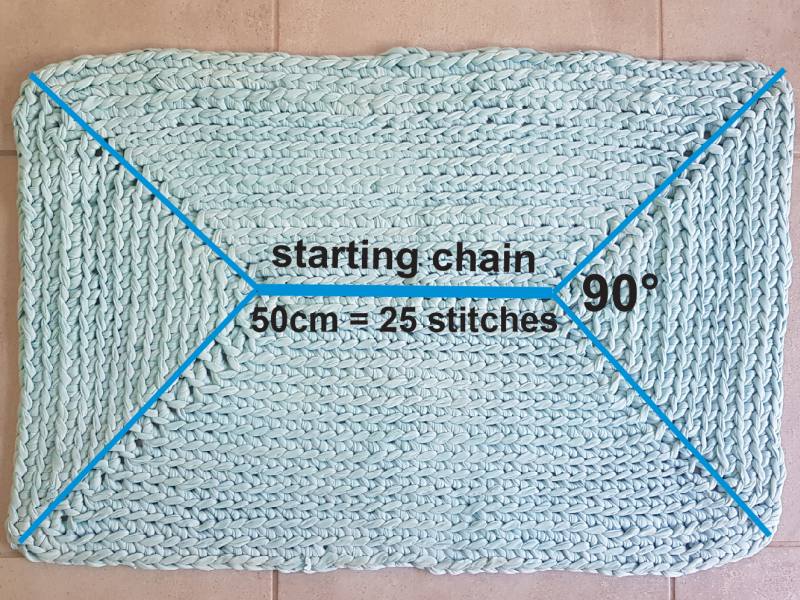
First, mark out on the floor how big you want the rug to be. Mark out two right-angled triangles on each end. Measure how long the starting chain needs to be. Calculate 2cm per stitch.
On this rug the starting chain was 50cm long, about 25 stitches.
Use a 10mm thick crocheting hook.
Create a chain (Step 4 on Sarah’s blog)
‘Work into the chain’ (Step 5)
As you get back to the beginning, put three stitches in the end loop of the chain (figure A below).
Crochet along the chain and do the same on the other end (A).
On the next round, add an extra stitch on each of the four corners (B).
On the following round, and each round thereafter, add two stitches in each corner (C).
With each round, there are two extra stitches on each side of the rectangle (D).
When the rug is big enough, or you run out of yarn, fasten off (Step 9).
On Youth Day (24 June 2022) the South African Youth Climate Change Coalition (SAYCCC) ran a workshop in Durban to strategize how to ramp up climate change action and activism, now that Covid-19 restrictions have been relaxed.
It was a timely opportunity for EASTERaction to hand out copies of What I Can Do About Climate Change booklet, and to present our plans for a brand new Action Programme to go with it, which we hope to roll out over the next year.
The booklet was originally written to inform eThekwini municipal councilors about personal climate action. One day before our workshop, the booklet was distributed at a climate induction workshop run by the Environmental Planning and Climate Protection Department.
Thank you SAYCCC for this opportunity and for your enthusiasm! We very much look forward collaborating on ‘the biggest challenge facing humankind ever’.


